Matplotlib is a plotting library for the Python programming language and its numerical mathematics extension NumPy. It provides an object-oriented API...
10 KB (778 words) - 10:44, 30 August 2024

use statsmodels.distributions.empirical_distribution.ECDF Matplotlib, using the matplotlib.pyplot.ecdf function (new in version 3.8.0) Seaborn, using...
13 KB (1,514 words) - 13:44, 4 September 2024
John D. Hunter (section Matplotlib)
August 28, 2012) was an American neurobiologist and the original author of Matplotlib. Hunter was brought up in Dyersburg, Tennessee, and attended The McCallie...
6 KB (500 words) - 08:37, 23 December 2023

Bitstream Vera Sans is also the default font used by the Python library Matplotlib to produce plots. Bitstream Vera itself covers Basic Latin and Latin 1-Supplement...
4 KB (337 words) - 14:28, 19 December 2023

available; SciPy is a library that adds more MATLAB-like functionality and Matplotlib is a plotting package that provides MATLAB-like plotting functionality...
22 KB (2,452 words) - 00:59, 29 July 2024

function using the Python Control Systems Library and Matplotlib. import control as ct import matplotlib.pyplot as plt # Define the transfer function sys =...
20 KB (2,859 words) - 04:52, 31 July 2024

1088/0957-0233/24/2/027001. ISSN 0957-0233. S2CID 12007380. "Symlog Demo". Matplotlib 3.4.2 documentation. 2021-05-08. Retrieved 2021-06-22. Ainslie, M. A....
13 KB (1,211 words) - 20:01, 3 August 2024

Color representation of the Dirichlet eta function. It is generated as a Matplotlib plot using a version of the Domain coloring method....
19 KB (3,707 words) - 16:11, 30 June 2024

blog.scientific-python.org. Retrieved 11 May 2023. "Matplotlib Awarded CZI EOSS Grant". Matplotlib. 14 November 2019. Retrieved 11 May 2023. "Accelerating...
33 KB (2,732 words) - 10:18, 25 July 2024

Hurwitz zeta function corresponding to a = 1/3. It is generated as a Matplotlib plot using a version of the Domain coloring method....
22 KB (4,220 words) - 10:29, 14 August 2024

online IC50 calculator (www.ic50.org) based on Python, NumPy, SciPy and Matplotlib ELISA IC50/EC50 Online Tool (link seems broken) IC50 to pIC50 calculator...
10 KB (1,084 words) - 20:25, 28 August 2024
prominent packages in the scientific Python stack, including NumPy, SciPy, Matplotlib, pandas, IPython, SymPy and Cython, as well as other open-source software...
9 KB (691 words) - 15:06, 30 August 2024

for value comparison tasks. Streamgraphs are officially supported by Matplotlib and D3.js. Marco Di Bartolomeo and Yifan Hu (2016) propose several improvements...
4 KB (436 words) - 12:28, 21 March 2024
is used (for example) by Dropbox. Libraries such as NumPy, SciPy and Matplotlib allow the effective use of Python in scientific computing, with specialized...
161 KB (13,328 words) - 12:30, 5 September 2024

A Python 3 based simulation using Matplotlib to sketch Buffon's needle experiment with the parameters t = 5.0, l = 2.6. Observe the calculated value of...
27 KB (4,304 words) - 02:01, 27 June 2024
scikit-learn integrates well with many other Python libraries, such as Matplotlib and plotly for plotting, NumPy for array vectorization, Pandas dataframes...
9 KB (809 words) - 17:43, 21 July 2024

supports Anaconda as well as multiple scientific packages including Matplotlib and NumPy. Front-end and back-end web development: special support for...
12 KB (784 words) - 07:59, 4 September 2024
spaCy for natural language processing, OpenCV for computer vision, and Matplotlib for data visualization. Hugging Face's transformers library can manipulate...
11 KB (1,150 words) - 09:35, 3 August 2024

algorithm in python (programming language) - import numpy as np import matplotlib.pyplot as plt # setting parameters (these values can be changed) xDomain...
59 KB (7,732 words) - 19:34, 29 August 2024

Hopper images in place of Lena by ivanov · Pull Request #1599 · matplotlib/matplotlib". GitHub. Retrieved July 9, 2020. "Grace Hopper Celebration of Women...
72 KB (6,907 words) - 03:03, 7 September 2024
alternative to address these performance concerns and other limitations. matplotlib NumPy Dask SciPy R (programming language) scikit-learn List of numerical...
13 KB (1,378 words) - 18:41, 6 September 2024

B(z)} , associated to 50 randomly chosen points in the unit disk. B(z) is represented as a Matplotlib plot, using a version of the Domain coloring method....
4 KB (597 words) - 11:53, 27 October 2023

wide-form dataset with the seaborn statistical visualization library based on matplotlib This article incorporates public domain material from Dataplot reference...
4 KB (483 words) - 01:03, 14 May 2024

mu) / x; } And to plot Wald distribution in Python using matplotlib and NumPy: import matplotlib.pyplot as plt import numpy as np h = plt.hist(np.random...
26 KB (2,973 words) - 18:58, 28 June 2024

provides integration with some libraries of the SciPy stack, notably matplotlib, producing inline graphs when used with the Jupyter notebook. Python libraries...
13 KB (1,034 words) - 18:05, 20 April 2024
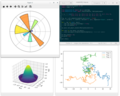
also frequently built into common visualisation toolboxes include: MPL (Matplotlib) color maps (including default Viridis) developed by Stéfan van der Walt...
27 KB (3,132 words) - 18:03, 31 July 2024

residuals and reconstructed matrix for a low-rank PCA approximation. Matplotlib – Python library have a PCA package in the .mlab module. mlpack – Provides...
114 KB (14,283 words) - 16:49, 3 July 2024
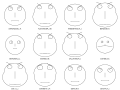
environment Example and code for Python using the matplotlib library ChernoffFace package in Python using the matplotlib library Function ChernoffFace in Wolfram...
11 KB (1,123 words) - 21:52, 26 August 2024

strap based ECG sportesters. Enables to inspect ECG recordings having lengths up to days. (Open source, non-commercial use, use matplotlib.) A demo video....
10 KB (1,054 words) - 09:52, 16 August 2024

consisting of 25 unit squares patched together. Bicubic interpolation as per Matplotlib's implementation. Colour indicates function value. The black dots are the...
15 KB (3,894 words) - 19:43, 3 December 2023