
Non-Hispanic Whites or Non-Latino Whites are White Americans classified by the United States census as "white" and not Hispanic. According to the United...
65 KB (3,630 words) - 18:58, 29 May 2024

states by Non-Hispanic whites population. The United States Census Bureau defines non-Hispanic white as white Americans who are not of Hispanic or Latino...
41 KB (492 words) - 10:40, 19 May 2024

among Hispanics in the United States relative to non-Hispanic Whites. According to the Center for Disease Control's 2015 Vital Signs report, Hispanics in...
42 KB (5,158 words) - 16:57, 28 May 2024

White Americans (redirect from American Whites)
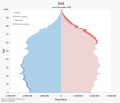
estimates that 75.5% of the US population were white alone, while Non-Hispanic whites were 58.9% of the population. For these population estimates, the...
86 KB (5,578 words) - 18:56, 12 June 2024

state or jurisdiction whose population is composed of less than 50% non-Hispanic whites. Racial data is derived from self-identification questions on the...
27 KB (2,563 words) - 05:34, 15 May 2024
White Americans in Maryland (redirect from Whites in Maryland)
Garrett and Carroll counties also have the highest percentage of non-Hispanic whites at 96.3% and 88.7%, respectively. Prince George's County (27%), Baltimore...
18 KB (1,741 words) - 10:23, 17 May 2024
between Hispanics and non-Hispanic whites. Using CDC data between 1990 and 2019, the ratio of the murder rate between Hispanics and non-Hispanic whites declined...
102 KB (12,478 words) - 18:15, 31 May 2024
the second-largest population group second only to non-Hispanic whites at 30.9.%. The first Hispanic presence in New York may have been that of the Portuguese...
5 KB (446 words) - 18:38, 1 October 2023
years. As of 2020, Hispanics had a life expectancy at birth of 78.8 years, followed by non-Hispanic Whites at 77.6 years and non-Hispanic blacks at 71.8 Years...
176 KB (22,539 words) - 01:45, 10 May 2024
research has found that the average non-European admixture is present in both white-Hispanics and non-Hispanic whites with different degrees according to...
35 KB (3,218 words) - 12:35, 3 June 2024

83% per the American Community Survey (ACS).[verification needed] Non-Hispanic whites make up 79% of the Midwest's population, the highest proportion of...
107 KB (10,651 words) - 23:06, 2 June 2024

calendar year. Although Hispanics do not lag behind non-Hispanic blacks when it comes to employment rates, they do lag non-Hispanic whites. There is a major...
44 KB (2,791 words) - 09:41, 30 May 2024
Demographics of the United States (section Percent of births to White Non-Hispanic women that were their 8th+ child, by US state, in 2021)
identified as white alone (including Hispanic whites) numbered 204,277,273 or 61.6% of the population and Non-Latino whites made up 57.8% of the country's population...
250 KB (13,019 words) - 16:02, 5 June 2024
States. Non-Hispanic whites decreased from about 76.3–78% of the state's population in 1970 to 36.5% in 2019. It was estimated in 2015 that Hispanic and Latino...
18 KB (1,427 words) - 10:53, 17 May 2024

Houston (category Pages with non-numeric formatnum arguments)
has a higher proportion of minorities than non-Hispanic whites; in 2010, whites (including Hispanic whites) made up 57.6% of the city of Houston's population;...
245 KB (21,938 words) - 19:46, 7 June 2024

Demographics of Chicago (redirect from Hispanics and Latinos in Chicago)
large Hispanic population is rather recent, with the segregation between Hispanics and non-Hispanic Whites being low when compared to Blacks and non-Hispanic...
35 KB (3,248 words) - 17:25, 27 May 2024

2012 United States House of Representatives elections in Florida (category Pages with non-numeric formatnum arguments)
68.5% non-Hispanic Whites (single race), 23.5% non-Hispanic Blacks (includes multirace), 4.4% Hispanic (excludes Hispanic Blacks), 0.3% Hispanic Blacks...
169 KB (6,539 words) - 04:13, 16 April 2024

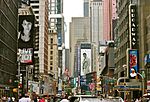
population of New York City was over 90% Non-Hispanic White until the post-World War II era. Large numbers of Blacks, Hispanics, or Asians began settling in Manhattan...
33 KB (1,950 words) - 03:16, 26 February 2024

White Namibians (redirect from Whites in Namibia)
southern Namibia. Windhoek has by far the largest White population, and Whites are a majority in the coastal city of Swakopmund. Other coastal cities,...
10 KB (757 words) - 00:57, 30 May 2024
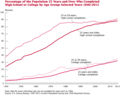
Americans, nearly a third (30%) of non-Hispanic whites, 17.3% of non-Hispanic blacks, and just over a tenth (11.4%) of Hispanics or Latinos had a four-year college...
64 KB (6,005 words) - 04:39, 4 June 2024
second highest percentage of non-Hispanic Whites (48%) of New York City's boroughs, after Staten Island (where non-Hispanic Whites make 64.0% of the residents)...
23 KB (2,707 words) - 20:39, 25 January 2024
where non-Hispanic whites formed less than half the population in the 2010 census, but no other ethnic or racial group had more people than non-Hispanic whites...
4 KB (255 words) - 21:02, 9 April 2022
Demographics of the Bronx (redirect from Hispanic and Latino Americans in the Bronx)
Bronx are characterized by a Hispanic majority (unique among New York City's boroughs) and by the lowest percentage of Whites among all boroughs. At the...
28 KB (2,782 words) - 07:53, 15 March 2024

bachelor's degree, compared to 28% for all Americans, and 34% for non-Hispanic whites. Taiwanese Americans have some of the highest education rates, with...
261 KB (23,132 words) - 16:28, 7 June 2024
Ethnic groups in Los Angeles (redirect from Hispanics and Latinos in Los Angeles)
1990 United States census and 2000 United States census found that non-Hispanic whites were becoming a minority in Los Angeles. Estimates for the 2010 United...
64 KB (5,946 words) - 19:15, 23 May 2024

slightly more births to Hispanics in the state than births to non-Hispanic whites. Since then, the gap has widened. In 2007, Hispanics accounted for 45% of...
21 KB (1,462 words) - 21:19, 4 April 2024
Demographics of Brooklyn (redirect from Hispanic and Latino Americans in Brooklyn)
non-Hispanic whites. Whites (both Hispanic and non-Hispanic) number near 1.3 million individuals, and there are nearly 1,150,000 non-Hispanic whites residing...
38 KB (3,664 words) - 02:38, 4 December 2023

Anglo has little currency as a catch-all term for non-Hispanic whites. Anglo is also used in non-Hispanic contexts. In Canada, where its usage dates at least...
8 KB (870 words) - 19:21, 4 May 2024

Poor White (redirect from Poor Whites)
sociocultural classification used to describe economically disadvantaged Whites in the English-speaking world, especially White Americans with low incomes...
25 KB (2,895 words) - 15:33, 23 May 2024

Demographics of Staten Island (redirect from Hispanic Americans in Staten Island)
was over three-quarters (75.7%) of the population. Over 323,000 non-Hispanic whites reside in the borough, and they make up 65.8% of the population....
24 KB (2,849 words) - 07:35, 21 May 2024