
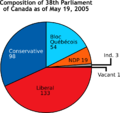
A pie chart (or a circle chart) is a circular statistical graphic which is divided into slices to illustrate numerical proportion. In a pie chart, the...
21 KB (2,312 words) - 16:41, 7 June 2024
represented by symbols, such as bars in a bar chart, lines in a line chart, or slices in a pie chart". A chart can represent tabular numeric data, functions...
13 KB (1,513 words) - 14:09, 21 July 2024
"American Pie" is a song by American singer and songwriter Don McLean. Recorded and released in 1971 on the album of the same name, the single was the...
91 KB (8,053 words) - 14:54, 23 July 2024

Misleading graph (redirect from Bad chart)
display the data of interest is discouraged for charts in general, not only for pie charts. In a 3D pie chart, the slices that are closer to the reader appear...
37 KB (3,978 words) - 05:11, 22 July 2024
"Sweetest Pie" is a song by American rapper Megan Thee Stallion and English-Albanian singer Dua Lipa, released on March 11, 2022, through 1501 Certified...
32 KB (2,190 words) - 13:27, 19 July 2024
reached number one on the Billboard 200, containing the chart-topping singles "American Pie" and "Vincent". Recorded in May and June 1971 at The Record...
16 KB (1,441 words) - 20:30, 8 October 2023
on the US Billboard 200 album chart, and hit number 20 in the UK and number 9 in Australia. The album was Humble Pie's first following the departure of...
8 KB (723 words) - 13:57, 11 July 2024

Treemapping (redirect from Rectangular pie chart)
York. Disk space analyzer Data and information visualization Marimekko Chart, a similar concept with one level of explicit hierarchy. Li, Rita Yi Man;...
21 KB (2,145 words) - 19:11, 16 July 2024

Humble Pie are an English rock band formed by singer-guitarists Peter Frampton and Steve Marriott in Moreton, Essex,[not verified in body] in 1969. Often...
35 KB (3,621 words) - 13:06, 15 July 2024
Univariate (statistics) (section Pie charts)
with the frequency of values assigned to a value range called a bin. Pie chart is a circle divided into portions that represent the relative frequencies...
12 KB (1,513 words) - 16:24, 14 June 2024
Flaming Pie is the tenth solo studio album by English musician Paul McCartney, released on 5 May 1997 by Parlophone in the UK and Capitol Records in the...
46 KB (4,007 words) - 14:18, 10 July 2024

A bar chart or bar graph is a chart or graph that presents categorical data with rectangular bars with heights or lengths proportional to the values that...
10 KB (1,282 words) - 07:46, 10 June 2024
Looker Studio (section Pie charts)
table, Scorecard, Gauge, Time series, Line, Area, Scatter, Bar, Pie, Google Maps, Geo chart, Bullet, and Treemap. After choosing the visualization method...
17 KB (1,843 words) - 16:50, 23 April 2024
American Pie is a 1999 American coming-of-age teen sex comedy film directed and co-produced by Paul Weitz and written by Adam Herz. It is the first film...
39 KB (3,630 words) - 06:01, 22 July 2024
BBC Schools (section The Pie Chart)
black and white card with a pie chart split into five segments with a BBC logo in the bottom right corner. The pie chart segments disappeared with the...
15 KB (2,003 words) - 10:15, 27 June 2024
This method is known as a multilevel pie chart, sunburst chart or ring chart. Users may also on the pie-chart segment representing a particular directory...
4 KB (273 words) - 18:10, 13 May 2024
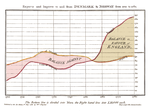
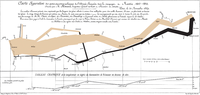
William Playfair (category Statistical charts and diagrams)
types of diagrams: in 1786 the line, area and bar chart of economic data, and in 1801 the pie chart and circle graph, used to show part-whole relations...
19 KB (2,134 words) - 02:37, 27 June 2024

Religion in Brazil (section Pie Chart notes)
The predominant religion in Brazil is Christianity, with Catholicism being its largest denomination. In 1891, when the first Brazilian Republican Constitution...
50 KB (4,910 words) - 05:58, 14 July 2024

graphs, bar charts, line graphs, area charts, and histograms. In his work, Statistical Breviary, he is credited with introducing the first pie chart. Around...
41 KB (4,841 words) - 01:10, 3 January 2024
Data and information visualization (category Statistical charts and diagrams)
include tables, charts and graphs (e.g. pie charts, bar charts, line charts, area charts, cone charts, pyramid charts, donut charts, histograms, spectrograms...
86 KB (7,868 words) - 06:59, 14 July 2024
Mainstream Rock Tracks chart and #36 on the Australian charts and spawning two music videos. Prior to the writing of the song "Cherry Pie", the album's title...
19 KB (1,555 words) - 23:28, 11 July 2024

Occupational Structure of Stocking Pelham is illustrated in a pie chart below. The chart shows that 46% of the residents at the time were employed in the...
7 KB (663 words) - 22:03, 3 September 2022
the successor service Google Charts. The following URL creates the pie chart below: http://chart.apis.google.com/chart? chs=200x200 &chdlp=b &chtt=Uberman...
5 KB (306 words) - 17:32, 3 July 2024
Laid (song) (category American Pie (film series))
success, charting in the United Kingdom, Australia, and the United States, and has received attention as a theme song for the American Pie film series...
9 KB (957 words) - 02:47, 10 May 2024
spreadsheets, and pie charts. After Mac states that it's difficult to capture a family vacation using a pie chart, PC rebuts by showing a pie chart representing...
63 KB (9,580 words) - 11:22, 7 July 2024

chart is also known as web chart, spider chart, spider graph, spider web chart, star chart, star plot, cobweb chart, irregular polygon, polar chart,...
20 KB (2,497 words) - 06:58, 17 June 2024
information visualization, a sunburst diagram or sunburst chart is a multilevel pie chart used to represent the proportion of different values found...
4 KB (392 words) - 21:26, 6 May 2024

Pie charts illustrating the difference between a mere plurality (where the green/bottom area is less than 50% of the total area) and a majority (where...
5 KB (625 words) - 13:49, 10 June 2024

Scatter plot (redirect from Scatter chart)
A scatter plot, also called a scatterplot, scatter graph, scatter chart, scattergram, or scatter diagram, is a type of plot or mathematical diagram using...
10 KB (1,063 words) - 14:10, 12 June 2024

design, a pie menu or radial menu is a circular context menu where selection depends on direction. It is a graphical control element. A pie menu is made...
21 KB (1,960 words) - 17:25, 8 May 2024