D3.js (also known as D3, short for Data-Driven Documents) is a JavaScript library for producing dynamic, interactive data visualizations in web browsers...
15 KB (1,516 words) - 17:53, 18 August 2024
the number of stars after D3.js, considered significantly easier to use though less customizable than the latter. Chart.js renders in HTML5 canvas and...
4 KB (236 words) - 20:00, 20 July 2024
receptor D3, a human gene Vitamin D3 (cholecalciferol), a type of Vitamin D Melanoma in situ (ICD-10 code: D03) Iodothyronine deiodinase type III d3.js, Data...
4 KB (621 words) - 17:55, 14 July 2024

Retrieved 2019-01-01. "Heatmap". D3.js Graph Gallery. Retrieved 25 July 2020. "Most basic heatmap in d3.js". D3.js Graph Gallery. Retrieved 25 July 2020...
24 KB (2,970 words) - 18:41, 19 June 2024
jQuery, MongoDB, and D3.js. TypeScript headers for the Node.js library modules are also available, allowing development of Node.js programs within TypeScript...
45 KB (3,434 words) - 07:27, 3 September 2024
github.io/billboard.js. "C3.js - D3-based reusable chart library". c3js.org. "CanvasJS Chart & StockChart License Pricing". CanvasJS. HTML5 Canvas based...
31 KB (1,002 words) - 18:59, 31 July 2024
a JavaScript library for rendering DOT files d3-graphviz – a JavaScript library based on Viz.js and D3.js that renders DOT graphs and supports animated...
10 KB (956 words) - 18:10, 3 August 2024
(software) CHR.js Google Polymer Dojo Toolkit jQuery MooTools Prototype JavaScript Framework AnyChart Babylon.js Chart.js Cytoscape D3.js Dojo Toolkit FusionCharts...
3 KB (182 words) - 11:59, 31 July 2024

from around the world. To accomplish this, L2W uses the graphics library D3.js. The concept of Listen to Wikipedia is based on BitListen, originally known...
5 KB (469 words) - 11:41, 7 July 2024

viable platforms that fit this model.[citation needed] Internet portal D3.js Software as a service (SaaS) Mobile development framework Web 2.0 Web engineering...
12 KB (1,208 words) - 03:28, 31 July 2024
low-level language suited to explanatory figures (the same use case as D3.js), while Vega-Lite is a higher-level language suited to rapidly exploring...
5 KB (351 words) - 07:31, 24 August 2024
JavaScript events. AnyChart D3.js Dojo Toolkit (dual BSD and AFL license) Google Charts Plotly.js Raphaël Three.js p5.js Comparison of JavaScript charting...
905 bytes (90 words) - 20:50, 8 September 2023
languages to coexist on an equal footing". It is possible to integrate D3.js charts as Dash components. Dash provides the default CSS (and HTML and JavaScript...
21 KB (1,262 words) - 15:02, 29 March 2023
Zoomdata Zoho Analytics (as part of the Zoho Office Suite) BIRT Project D3.js JasperReports KNIME LibreOffice Base OpenOffice Base Pentaho Business intelligence...
2 KB (127 words) - 11:49, 21 December 2023
Mike Bostock (category D3.js people)
specialist. He is one of the co-creators of Observable and a key developer of D3.js, a JavaScript library used to produce dynamic, interactive data visualizations...
8 KB (597 words) - 00:00, 28 October 2023
Bentley Map, desktop and server based GIS products Cadcorp SIS product suite D3.js ESRI's ArcGIS products GeoMedia Global Mapper Kinetica Manifold System MapInfo...
8 KB (851 words) - 15:01, 23 April 2024
focus from AngularJS to React.js as the front-end library of choice. There were a number of additions to the coursework, including D3.js and Sass, which...
19 KB (1,659 words) - 17:39, 7 June 2024
the Apache Software Foundation BIRT Project, by the Eclipse Foundation D3.js JasperReports KNIME Orange Pentaho TACTIC Superset Grafana JasperReports:...
8 KB (705 words) - 07:21, 15 August 2024

comparison tasks. Streamgraphs are officially supported by Matplotlib and D3.js. Marco Di Bartolomeo and Yifan Hu (2016) propose several improvements to...
4 KB (436 words) - 12:28, 21 March 2024

libraries and application programming interfaces (e.g., GDAL, Leaflet, D3.js) that extend programming languages to enable the incorporation of GIS data...
101 KB (13,112 words) - 06:13, 21 August 2024
open-source data visualization software made in JavaScript. It employs D3.js for the creation of editable visualizations in SVG format. The project was...
6 KB (481 words) - 20:38, 12 September 2023
to use the color space. Some implementations include: Statistical tools: d3.js: Data Driven Documents JavaScript library (CIELChab) Swatch designs: The...
12 KB (1,132 words) - 09:11, 11 July 2024
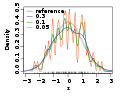
KernelEstimator, among others. In JavaScript, the visualization package D3.js offers a KDE package in its science.stats package. In JMP, the Graph Builder...
38 KB (4,535 words) - 09:49, 13 June 2024
analysis Interactive figures – Authorea supports interactive figures using D3.js GitHub and Offline Editing – Documents and files are stored in Git repositories...
12 KB (1,113 words) - 23:43, 5 June 2024

The phylogenetic tree of global human mitochondrial DNA variation PhyloD3 – D3.js-based phylogenetic tree based on PhyloTree MitoTool – a web server for...
36 KB (3,302 words) - 22:41, 21 August 2024

Jeffrey Heer (category D3.js people)
Stanford University faculty, he worked with Mike Bostock on the Protovis and D3.js systems. Heer then moved to the University of Washington where he worked...
7 KB (508 words) - 01:24, 28 December 2023

Analytics for Business". LinkedIn. Retrieved 20 July 2018. Media related to Bubble charts at Wikimedia Commons Example of bubble chart with d3.js (FDI G20)...
8 KB (976 words) - 19:30, 10 July 2024

Kreft L, Botzki A, Coppens F, Vandepoele K, Van Bel M (September 2017). "PhyD3: a phylogenetic tree viewer with extended phyloXML support for functional...
24 KB (1,648 words) - 15:35, 28 June 2024

D3plus is an open source (MIT license) JavaScript library built on top of D3.js by Alexander Simoes and Dave Landry. It is also used on other visualization...
7 KB (853 words) - 19:04, 13 July 2024

Mondrian, Orange and ROOT. Libraries include Protovis.js, D3.js provides basic examples. D3.Parcoords.js (a D3-based library) specifically dedicated to parallel...
14 KB (1,659 words) - 12:18, 10 July 2024