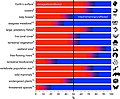
A rank abundance curve or Whittaker plot is a chart used by ecologists to display relative species abundance, a component of biodiversity. It can also...
3 KB (397 words) - 18:33, 7 August 2024
of abundance bins (historically log2 as a rough approximation to the natural logarithm) y-axis: number of species at given abundance Rank-abundance diagram...
20 KB (2,589 words) - 15:29, 17 February 2024

of the world's ecosystems, biologists have repeatedly observed a rank-abundance curve in which ecosystems comprise a handful of incredibly abundant species...
12 KB (1,234 words) - 18:19, 10 July 2024
less common. After this, the rank of abundance does not continue to correspond to the atomic number. Oxygen has abundance rank 3, but atomic number 8. There...
41 KB (4,306 words) - 06:41, 7 October 2024
(statistics) Rank abundance curve Rank correlation mainly links to two following Spearman's rank correlation coefficient Kendall tau rank correlation coefficient...
87 KB (8,285 words) - 04:29, 7 October 2024
function of their observed abundance. The SAD is one of ecology's oldest and most universal laws – every community shows a hollow curve or hyperbolic shape on...
3 KB (297 words) - 16:51, 6 January 2024
patterns change with scale, when modeling species distributions. Rank abundance curve McGeoch, Melodie A.; Kevin J. Gaston (August 2002). "Occupancy frequency...
17 KB (1,851 words) - 09:00, 8 September 2024
symbols, but can be very easily calculated. An example of a species abundance curve can be found in Scientific American. UNTB distinguishes between a dispersal-limited...
33 KB (5,012 words) - 02:31, 27 December 2023

— Plant Resources of Tropical Africa — Range condition scoring — Rank abundance curve — Rare species — Rarefaction (ecology) — Reconciliation ecology —...
8 KB (674 words) - 10:56, 6 November 2022
over time takes the form of a sigmoid curve, reaching its highest level at K. This is the logistic growth curve and it is calculated with: f ( x ) = L...
57 KB (6,891 words) - 23:35, 3 October 2024
of population density. The logistic growth curve is initially very similar to the exponential growth curve. When population density is low, individuals...
23 KB (2,707 words) - 02:21, 17 March 2024
distribution of abundances of individuals among species. The relative abundances of species are usually expressed as a Whittaker plot, or rank abundance plot, where...
16 KB (2,102 words) - 10:12, 31 January 2023

Extinction event (redirect from Sepkoski curve)
Earth. Such an event is identified by a sharp fall in the diversity and abundance of multicellular organisms. It occurs when the rate of extinction increases...
147 KB (15,027 words) - 21:35, 15 October 2024

Playing card suit (section Suited-and-ranked decks)
alternatively or additionally be indicated by the color printed on the card. The rank for each card is determined by the number of pips on it, except on face cards...
39 KB (3,638 words) - 07:40, 4 September 2024
For early Brahmi numerals, 7 was written more or less in one stroke as a curve that looks like an uppercase ⟨J⟩ vertically inverted (ᒉ). The western Arab...
41 KB (4,180 words) - 06:21, 10 October 2024

effects of a very local environment. Therefore, ecotypes have no taxonomic rank. Ecotypes are closely related to morphs. In the context of evolutionary biology...
14 KB (1,668 words) - 13:05, 1 October 2024
frequently used in endangered species management to develop a plan of action, rank the pros and cons of different management scenarios, and assess the potential...
17 KB (2,251 words) - 07:13, 29 April 2024

representation of relative species abundances are species ranks, used to generate a surface called the species-rank surface, which can be analyzed using...
31 KB (3,325 words) - 19:35, 13 September 2024
plenty or the poverty paradox, is the hypothesis that countries with an abundance of natural resources (such as fossil fuels and certain minerals) have...
90 KB (10,850 words) - 13:18, 10 September 2024

Energy quality (section Energy abundance and relative transformation ease as measure of hierarchical rank and/or hierarchical position)
Ohta therefore also included, 'abundance in nature' as another criterion for the determination energy quality rank. For example, Ohta said that, "the...
16 KB (2,160 words) - 09:08, 9 March 2024
separate curve. Aggregate demand must equal total income, so equilibrium income must be determined by the point where the aggregate demand curve crosses...
107 KB (13,226 words) - 21:36, 9 October 2024

strongly associated with greater migratory bird species richness and abundance. Coppicing of waterside willows and cottonwoods by beavers leads to dense...
77 KB (8,738 words) - 23:14, 17 September 2024
to be confused with ab absurdo ("from the absurd"). ad abundantiam to abundance Used in legal language when providing additional evidence to an already...
2 KB (3,737 words) - 21:16, 17 August 2024

Duftner; Michaela Maderbacher; Martin Koch; Stephan Koblmüller (2008). "Abundance, Distribution, and Territory Areas of Rock-dwelling Lake Tanganyika Cichlid...
107 KB (13,874 words) - 20:20, 5 February 2024
the song with Curve in 1993 for the Peace Together album. The recording was also included on Curve's 2004 compilation album The Way of Curve. Although the...
6 KB (793 words) - 08:03, 2 July 2023

is captured by the demand curve, whereas the sellers’ behaviour is captured by the supply curve. By putting these two curves on the same graph, economists...
227 KB (25,220 words) - 00:16, 14 October 2024
has particular ecological meaning, because they relate to the species abundance, optimum and tolerance respectively. For example, the tolerance is a measure...
29 KB (4,737 words) - 05:18, 13 June 2023

2012. Retrieved October 29, 2010. Tyson, N.D. (1992). A study of the abundance distributions along the minor axis of the Galactic bulge (PhD thesis)...
94 KB (9,132 words) - 07:28, 25 September 2024
backwaters. Oxygen is a byproduct of photosynthesis, so systems with a high abundance of aquatic algae and plants may also have high concentrations of oxygen...
84 KB (9,930 words) - 06:34, 19 May 2024
sample. The ratio of abundance of one species to one or multiple other species living in an ecosystem is called relative species abundance. Both indicators...
121 KB (14,677 words) - 20:52, 13 October 2024