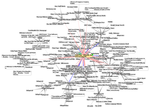
Social visualization is an interdisciplinary intersection of information visualization to study creating intuitive depictions of massive and complex social...
10 KB (1,435 words) - 19:42, 1 December 2023
manner (presentational or explanatory visualization), it is typically called information graphics. Data visualization is concerned with visually presenting...
86 KB (7,868 words) - 16:59, 29 June 2024
interaction and visualization for the analysis and interpretation of contingency analysis results". Graphical Interaction and Visualization for the Analysis...
60 KB (6,356 words) - 11:23, 26 June 2024
Fernanda Viégas (category Information visualization experts)
graphical designer, whose work focuses on the social, collaborative and artistic aspects of information visualization. Viégas studied graphic design and art...
10 KB (933 words) - 23:08, 7 April 2024
Career Award for Visualization Research from the IEEE Technical Committee on Visualization and Graphics (VGTC) at the IEEE Visualization Conference, He...
13 KB (1,127 words) - 02:24, 3 March 2024
spatial visualization and mental rotation sound similar, mental rotation is a particular task that can be accomplished using spatial visualization. The Minnesota...
10 KB (1,191 words) - 09:38, 6 December 2023
Scientific visualization (also spelled scientific visualisation) is an interdisciplinary branch of science concerned with the visualization of scientific...
27 KB (3,072 words) - 15:50, 14 December 2023
Infographic (redirect from International Conference on Information Visualization)
see patterns and trends. Similar pursuits are information visualization, data visualization, statistical graphics, information design, or information...
41 KB (4,841 words) - 01:10, 3 January 2024
"creative visualization" signifies the process by which a person generates and processes visual mental imagery specifically. However, creative visualization is...
37 KB (5,036 words) - 03:57, 22 April 2024
Graph drawing (redirect from Graph visualization)
theory and information visualization to derive two-dimensional depictions of graphs arising from applications such as social network analysis, cartography...
31 KB (3,269 words) - 20:56, 20 June 2024
The Russian Social Democratic Labour Party (RSDLP; Russian: Российская социал-демократическая рабочая партия (РСДРП), Rossiyskaya sotsial-demokraticheskaya...
21 KB (1,890 words) - 20:59, 12 May 2024
System for Graph-based Visualization of the Evolution of Software", Proceedings of the 2003 ACM Symposium on Software Visualization (SoftVis '03), New York...
17 KB (2,220 words) - 11:32, 15 April 2024
analytics 2005: Baby Names, Visualization, and Social Data Analysis Martin Wattenberg. IEEE Symposium on Information Visualization. Bollen, Johan; Mao, Huinan;...
6 KB (767 words) - 06:05, 29 November 2022
Software visualization or software visualisation refers to the visualization of information of and related to software systems—either the architecture...
13 KB (1,417 words) - 23:08, 11 January 2024
representations of social networks are important to understand network data and convey the result of the analysis. Visualization often also facilitates...
20 KB (1,324 words) - 23:09, 11 January 2024
Video wall (redirect from Visualization for Display Walls)
significantly larger surface. Jason Leigh and others at the Electronic Visualization Laboratory, University of Illinois, Chicago, developed SAGE, the Scalable...
19 KB (2,365 words) - 23:59, 24 May 2024
Visual analytics (category Visualization (graphics))
analytics is an outgrowth of the fields of information visualization and scientific visualization that focuses on analytical reasoning facilitated by interactive...
14 KB (1,731 words) - 03:57, 26 June 2024
Social norms are shared standards of acceptable behavior by groups. Social norms can both be informal understandings that govern the behavior of members...
69 KB (8,399 words) - 18:09, 28 June 2024
social network is a social structure made up of a set of social actors (such as individuals or organizations), sets of dyadic ties, and other social interactions...
67 KB (7,457 words) - 16:12, 1 July 2024
goal of visualization is to understand and make sense of the information. Storytelling helps the viewer gain insight from the data. Visualization should...
30 KB (3,534 words) - 20:58, 10 April 2024
The social determinants of health (SDOH) are the economic and social conditions that influence individual and group differences in health status. They...
92 KB (11,748 words) - 13:47, 1 July 2024
covered by this software are social networking for businesses, online meetings, file sharing, instant messaging, data visualization, and e-mail. The mentioned...
5 KB (413 words) - 06:47, 27 March 2024
high, the social systems of a country can be heavily burdened. All numbers are for the year 2023. Source is The World Factbook. Visualization based on...
11 KB (131 words) - 19:13, 13 March 2024
DataViva (category Data visualization software)
DataViva is an information visualization engine created by the Strategic Priorities Office of the government of Minas Gerais. DataViva makes official...
6 KB (408 words) - 15:44, 5 July 2024
published a book entitled Creative Visualization in 1978. The first line of the book reads "Creative Visualization is the technique of creating what you...
9 KB (991 words) - 20:49, 5 February 2024
D3.js (category JavaScript visualization toolkits)
Stanford Visualization Group created Protovis, a JavaScript library to generate SVG graphics from data. The library was known to data visualization practitioners...
15 KB (1,510 words) - 15:37, 6 May 2024
The Social Security debate in the United States encompasses benefits, funding, and other issues. Social Security is a social insurance program officially...
127 KB (15,624 words) - 01:48, 21 May 2024
Product design (redirect from Creative visualization (design))
Co-operative Animation: Beyond Creative Visualization in Automotive Design. In Cooperative Design, Visualization, and Engineering. Springer Berlin Heidelberg...
15 KB (1,957 words) - 21:43, 28 March 2024
NodeXL (redirect from Social Media Research Foundation)
analysis and visualization software package for Microsoft Excel 2007/2010/2013/2016. The package is similar to other network visualization tools such as...
16 KB (1,591 words) - 08:25, 19 May 2024
Mass customization (redirect from Configurator visualization)
international modular jewellery market". Journal of Humanities and Applied Social Science. 1 (1): 25–42. doi:10.1108/JHASS-05-2019-002. Chase, Richard B.;...
9 KB (1,106 words) - 20:41, 22 April 2024


