Taylor diagrams are mathematical diagrams designed to graphically indicate which of several approximate representations (or models) of a system, process...
11 KB (1,321 words) - 05:33, 22 April 2024

diagram is a widely used diagram style that shows the logical relation between sets, popularized by John Venn (1834–1923) in the 1880s. The diagrams are...
31 KB (3,249 words) - 08:21, 15 October 2024

Cremona diagram De Finetti diagram Dynkin diagram Elementary diagram Euler diagram Stellation diagram Ulam spiral Van Kampen diagram Taylor diagram Category...
13 KB (1,576 words) - 20:25, 20 August 2023
In mathematics, a unitary spider diagram adds existential points to an Euler or a Venn diagram. The points indicate the existence of an attribute described...
3 KB (333 words) - 23:03, 8 December 2023

In theoretical physics, a Feynman diagram is a pictorial representation of the mathematical expressions describing the behavior and interaction of subatomic...
93 KB (16,016 words) - 23:31, 17 October 2024

A state diagram is used in computer science and related fields to describe the behavior of systems. State diagrams require that the system is composed...
15 KB (1,958 words) - 09:34, 21 May 2024

spacetime diagram is a graphical illustration of locations in space at various times, especially in the special theory of relativity. Spacetime diagrams can...
48 KB (6,173 words) - 07:38, 10 October 2024
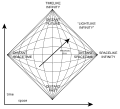
theoretical physics, a Penrose diagram (named after mathematical physicist Roger Penrose) is a two-dimensional diagram capturing the causal relations...
10 KB (1,206 words) - 14:20, 30 August 2024
Sciences. Calibration (statistics) Brier Skill Score (within Brier score) Taylor diagram "American Meteorological Society". Glossary of Meteorology. Gneiting...
6 KB (724 words) - 07:05, 11 January 2024

Comparison diagram or comparative diagram is a general type of diagram, in which a comparison is made between two or more objects, phenomena or groups...
11 KB (1,266 words) - 00:03, 4 February 2024
America states that the diamond is D colour, VS1 clarity; accompanied by a diagram indicating that the clarity may be potentially internally flawless. There...
6 KB (746 words) - 09:08, 28 June 2024

analemma (/ˌænəˈlɛmə/; from Ancient Greek ἀνάλημμα (analēmma) 'support') is a diagram showing the position of the Sun in the sky as seen from a fixed location...
35 KB (4,584 words) - 19:34, 23 September 2024
Spaghetti plot (redirect from Spaghetti diagram)
A spaghetti plot (also known as a spaghetti chart, spaghetti diagram, or spaghetti model) is a method of viewing data to visualize possible flows through...
9 KB (1,018 words) - 13:26, 24 April 2024

PERT offers a management tool,: 497 which relies "on arrow and node diagrams of activities and events: arrows represent the activities or work necessary...
28 KB (3,839 words) - 11:10, 3 October 2024

Joseph Hooton Taylor Jr. (born March 29, 1941) is an American astrophysicist and Nobel Prize laureate in Physics for his discovery with Russell Alan Hulse...
13 KB (1,135 words) - 15:10, 12 September 2024

elaborated using diagrams. Such diagrams identify the actor and the processes they perform. System Sequence Diagram: A System Sequence diagrams (SSD) is a picture...
30 KB (3,192 words) - 06:37, 16 October 2024
(Chinese: 太極圖; pinyin: tàijítú; Wade–Giles: tʻai⁴chi²tʻu²) is a symbol or diagram (圖; tú) representing taiji (太極; tàijí; 'utmost extreme') in both its monist...
28 KB (3,134 words) - 20:33, 20 September 2024

System dynamics (section Causal loop diagrams)
a book titled World Dynamics. The primary elements of system dynamics diagrams are feedback, accumulation of flows into stocks and time delays. As an...
23 KB (2,991 words) - 17:08, 11 July 2024
421/521: Introductory Optomechanical Engineering "ATMAE Membership Venn Diagram" Archived 2013-11-13 at the Wayback Machine. atmae.org Ravindran, Ravi;...
33 KB (308 words) - 11:30, 7 October 2024

Additionally, thermodynamic phase diagrams for water/steam, such as a temperature-entropy diagram or a Mollier diagram shown in this article, may be useful...
14 KB (1,556 words) - 17:03, 13 October 2024
Cooke Optics (redirect from Taylor, Taylor & Hobson)
television high quality lenses for cinema projectors Cooke / Taylor-Hobson lens diagrams Triplet (Taylor, 1893) Aviar (Warmisham, 1917) OPIC (Lee, 1920) Inverted...
7 KB (791 words) - 14:37, 13 February 2024

Charles Day (engineer) (section Routing diagram)
operation, and for his seminal contributions to flow charts and the routing diagram. Day was born in 1879 in Germantown, Philadelphia, son of Charles A. Day...
26 KB (3,316 words) - 13:31, 9 January 2024
example, this occurs with a uniformly accelerated particle. A spacetime diagram of this situation is shown in the figure to the right. As the particle...
29 KB (3,589 words) - 15:25, 30 September 2024

diagram of hyphae, referring to the Rhizobium on damp, stale whole-meal bread or on rotting fruit. Clegg & Mackean (2006, p. 296), fig 14.16—Diagram detailing...
7 KB (767 words) - 17:15, 30 August 2024

Relativity of simultaneity (section Spacetime diagrams)
the train are at the same level in the diagram. This means that the events are simultaneous. In the second diagram, the two ends of the train moving to...
21 KB (2,668 words) - 09:23, 3 October 2024

Gantt chart (category Diagrams)
diagrams are superior to visually communicate the relationships between tasks. Nevertheless, Gantt charts are often preferred over network diagrams because...
18 KB (1,790 words) - 12:44, 8 October 2024
effect Thomas precession Ladder paradox Twin paradox Terrell rotation Spacetime Light cone World line Minkowski diagram Biquaternions Minkowski space...
34 KB (5,101 words) - 23:04, 11 October 2024
escape into either universe. All four regions can be seen in a spacetime diagram that uses Kruskal–Szekeres coordinates (see figure). In this spacetime...
29 KB (3,424 words) - 03:46, 2 September 2024

Canon INC. Retrieved 26 December 2012. "Canon Serenar 28mm f/3.5 I Block Diagram". Canon INC. Archived from the original on 23 May 2013. Retrieved 26 December...
18 KB (2,066 words) - 14:26, 21 April 2024

Cooke triplet (redirect from Taylor-Cook Triplet)
derivative design diagrams Cooke triplet (Taylor, 1893) Voigtländer Heliar (Harting, 1900) Voigtländer Dynar (Harting, 1903) Taylor Hobson Speedic (Lee...
13 KB (1,386 words) - 18:54, 4 October 2024