
Control charts are graphical plots used in production control to determine whether quality and manufacturing processes are being controlled under stable...
32 KB (3,806 words) - 18:51, 7 June 2024
lawsuit in March 2014 by Media Control AG, Media Control® GfK International had to change its name. Dissemination of the charts is conducted by various media...
9 KB (904 words) - 03:53, 2 June 2024

In statistical quality control, the individual/moving-range chart is a type of control chart used to monitor variables data from a business or industrial...
11 KB (1,174 words) - 06:38, 5 August 2024
some of them: Control chart Greninger chart Heatmap Natal chart Nomogram Pareto chart Run chart Strip chart Structure chart Vowel chart One more example:...
13 KB (1,513 words) - 16:24, 2 September 2024
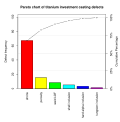
purpose of the Pareto chart is to highlight the most important among a (typically large) set of factors. In quality control, Pareto charts are useful to find...
4 KB (462 words) - 17:28, 17 July 2024
Distribution-free (nonparametric) control charts are one of the most important tools of statistical process monitoring and control. Implementation techniques...
4 KB (503 words) - 11:51, 28 October 2020

In statistical quality control, the p-chart is a type of control chart used to monitor the proportion of nonconforming units in a sample, where the sample...
8 KB (760 words) - 08:10, 9 February 2024
management. A control chart is a more specific kind of run chart. The control chart is one of the seven basic tools of quality control, which also include...
9 KB (1,168 words) - 22:27, 28 May 2024

A bar chart or bar graph is a chart or graph that presents categorical data with rectangular bars with heights or lengths proportional to the values that...
10 KB (1,279 words) - 02:46, 19 October 2024
specifications) output can be measured. Key tools used in SPC include run charts, control charts, a focus on continuous improvement, and the design of experiments...
20 KB (2,584 words) - 03:58, 2 September 2024

In statistical quality control, the EWMA chart (or exponentially weighted moving average chart) is a type of control chart used to monitor either variables...
6 KB (684 words) - 15:24, 20 March 2024

statistical process control (SPC), the x ¯ {\displaystyle {\bar {x}}} and R chart is a type of scheme, popularly known as control chart, used to monitor...
6 KB (699 words) - 05:49, 21 May 2024
Swims – Chart History (Argentina Hot 100)" Billboard Argentina Hot 100 Singles for Teddy Swims. Retrieved June 9, 2024. "Teddy Swims – Lose Control". ARIA...
40 KB (2,762 words) - 19:49, 12 October 2024

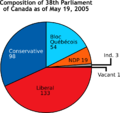
pie chart (or a circle chart) is a circular statistical graphic which is divided into slices to illustrate numerical proportion. In a pie chart, the...
21 KB (2,312 words) - 16:41, 7 June 2024
In statistical quality control, the regression control chart allows for monitoring a change in a process where two or more variables are correlated. The...
1 KB (133 words) - 00:16, 15 April 2023
in the Swiss charts), with Branigan's rendition becoming the most successful single of the year in Germany and Switzerland. "Self Control" has become one...
44 KB (3,776 words) - 19:42, 11 October 2024

Flowchart (redirect from Flow-chart)
as "cross-functional" when the chart is divided into different vertical or horizontal parts, to describe the control of different organizational units...
22 KB (1,753 words) - 20:53, 10 September 2024
version of Raf's "Self Control", which was a commercial success, peaking at number four on the US Billboard Hot 100 and topping the charts in Canada and several...
19 KB (1,211 words) - 13:42, 13 September 2024

chart is also known as web chart, spider chart, spider graph, spider web chart, star chart, star plot, cobweb chart, irregular polygon, polar chart,...
20 KB (2,497 words) - 06:58, 17 June 2024
CUSUM (redirect from Cumulative sum control chart)
In statistical quality control, the CUSUM (or cumulative sum control chart) is a sequential analysis technique developed by E. S. Page of the University...
7 KB (725 words) - 20:06, 22 April 2024

A scientific control is an experiment or observation designed to minimize the effects of variables other than the independent variable (i.e. confounding...
12 KB (1,456 words) - 11:27, 28 August 2024

Quality control (QC) is a process by which entities review the quality of all factors involved in production. ISO 9000 defines quality control as "a part...
13 KB (1,045 words) - 07:00, 13 August 2024

In statistical quality control, the u-chart is a type of control chart used to monitor "count"-type data where the sample size is greater than one, typically...
3 KB (282 words) - 15:18, 10 March 2020

decreases. Run charts are similar in some regards to the control charts used in statistical process control, but do not show the control limits of the...
3 KB (365 words) - 12:05, 14 September 2024

Box plot (redirect from Box and whisker chart)
introduced by Mary Eleanor Spear in her book "Charting Statistics" in 1952 and again in her book "Practical Charting Techniques" in 1969. The box-and-whisker...
20 KB (2,994 words) - 11:13, 28 June 2024

In statistical quality control, the x ¯ {\displaystyle {\bar {x}}} and s chart is a type of control chart used to monitor variables data when samples are...
9 KB (934 words) - 01:12, 17 July 2024
Seven basic tools of quality (redirect from Seven Basic Tools of Quality Control)
Cause-and-effect diagram Check sheet Control chart Histogram Pareto chart Scatter diagram Flow chart Run chart The seven basic tools of quality are a...
7 KB (789 words) - 06:56, 11 June 2024

quality control, the np-chart is a type of control chart used to monitor the number of nonconforming units in a sample. It is an adaptation of the p-chart and...
2 KB (181 words) - 19:41, 30 September 2019

In statistical quality control, the c-chart is a type of control chart used to monitor "count"-type data, typically total number of nonconformities per...
3 KB (364 words) - 07:46, 30 March 2024
Western Electric rules (category Quality control tools)
control for detecting out-of-control or non-random conditions on control charts. Locations of the observations relative to the control chart control limits...
8 KB (659 words) - 11:02, 3 November 2023