analysis in the presence of heteroscedasticity, which led to his formulation of the autoregressive conditional heteroscedasticity (ARCH) modeling technique...
27 KB (3,197 words) - 00:51, 2 May 2025
Autoregressive conditional heteroskedasticity (redirect from Autoregressive conditional heteroscedasticity)
Garthoff, R. (2018). "Generalised spatial and spatiotemporal autoregressive conditional heteroscedasticity". Spatial Statistics. 26 (1): 125–145. arXiv:1609...
23 KB (3,837 words) - 12:25, 30 June 2025
Linear regression (section Heteroscedastic models)
including weighted least squares and the use of heteroscedasticity-consistent standard errors can handle heteroscedasticity in a quite general way. Bayesian...
76 KB (10,482 words) - 04:54, 7 July 2025
exhibit a phenomenon called heteroscedasticity. If all of the residuals are equal, or do not fan out, they exhibit homoscedasticity. However, a terminological...
16 KB (2,164 words) - 16:12, 23 May 2025
Box plot (redirect from Box-and-whisker diagram)
or boxplot is a method for demonstrating graphically the locality, spread and skewness groups of numerical data through their quartiles. In addition to...
20 KB (3,012 words) - 00:34, 29 April 2025
distributed under the null hypothesis, specifically Pearson's chi-squared test and variants thereof. Pearson's chi-squared test is used to determine whether...
22 KB (2,432 words) - 16:59, 17 March 2025
B and C (which compare equal) which are both ranked ahead of D, then A gets ranking number 1 ("first") and D gets ranking number 4 ("fourth"), and either...
17 KB (2,416 words) - 05:56, 14 May 2025
analysis in the presence of heteroscedasticity, which led to his formulation of the autoregressive conditional heteroscedasticity (ARCH) modeling technique...
5 KB (1,161 words) - 20:10, 22 December 2024
Statistician (category Statistics profession and organizations)
exists in both the private and public sectors. It is common to combine statistical knowledge with expertise in other subjects, and statisticians may work...
7 KB (574 words) - 11:54, 22 January 2025
Data (section Etymology and terminology)
organized into structures such as tables that provide additional context and meaning, and may themselves be used as data in larger structures. Data may be used...
24 KB (2,822 words) - 09:14, 1 June 2025
A/B testing (section Segmentation and targeting)
consist of a randomized experiment that usually involves two variants (A and B), although the concept can be also extended to multiple variants of the...
29 KB (3,044 words) - 11:40, 8 July 2025
F-test (section Formula and calculation)
Bartlett's test, and the Brown–Forsythe test. However, when any of these tests are conducted to test the underlying assumption of homoscedasticity (i.e. homogeneity...
17 KB (2,189 words) - 12:02, 28 May 2025
Double descent in statistics and machine learning is the phenomenon where a model with a small number of parameters and a model with an extremely large...
10 KB (923 words) - 10:43, 24 May 2025
Pie chart (category Statistical charts and diagrams)
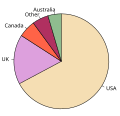
proportion. In a pie chart, the arc length of each slice (and consequently its central angle and area) is proportional to the quantity it represents. While...
22 KB (2,340 words) - 01:45, 6 May 2025
Standard error (category Statistical deviation and dispersion)
population and recording the sample mean per sample. This forms a distribution of different means, and this distribution has its own mean and variance....
20 KB (2,781 words) - 01:28, 24 June 2025
population and associated techniques of survey data collection, such as questionnaire construction and methods for improving the number and accuracy of...
35 KB (4,242 words) - 18:13, 24 May 2025
Methods engineering (redirect from Time and methods engineering)
Methods engineering is a subspecialty of industrial engineering and manufacturing engineering concerned with human integration in industrial production...
5 KB (616 words) - 04:44, 14 July 2022
stochastic process given the noisy and/or partial observations. The state-space model can be nonlinear and the initial state and noise distributions can take...
95 KB (16,934 words) - 15:13, 4 June 2025
(2016-12-19). "Nonnegative Matrix Factorization (NMF) with Heteroscedastic Uncertainties and Missing data". arXiv:1612.06037 [astro-ph.IM]. Ren, Bin; Pueyo...
117 KB (14,851 words) - 03:05, 30 June 2025
In mathematical optimization and decision theory, a loss function or cost function (sometimes also called an error function) is a function that maps an...
21 KB (2,800 words) - 06:57, 24 June 2025
requires the assumptions of stronger forms of predeterminedness and conditional homoscedasticity. Consider a linear regression of any form, for example Y t...
9 KB (1,164 words) - 06:42, 1 May 2025
calculating confidence intervals, and the best method depends on the situation. Two widely applicable methods are bootstrapping and the central limit theorem...
31 KB (4,000 words) - 19:33, 20 June 2025
unit-treatment additivity) and uses the randomization procedure of the experiment. Both these analyses require homoscedasticity, as an assumption for the...
56 KB (7,645 words) - 06:39, 28 May 2025
psychology, and political science. Monte Carlo methods have been recognized as one of the most important and influential ideas of the 20th century, and they...
92 KB (10,691 words) - 07:51, 10 July 2025
a mean or a standard deviation. If a population exactly follows a known and defined distribution, for example the normal distribution, then a small set...
5 KB (670 words) - 21:17, 7 May 2025
Stationary process (redirect from Stationary and nonstationary random processes)
In mathematics and statistics, a stationary process (also called a strict/strictly stationary process or strong/strongly stationary process) is a stochastic...
20 KB (2,612 words) - 23:36, 24 May 2025
Generative model (redirect from Generative and discriminative models)
statistical classification, two main approaches are called the generative approach and the discriminative approach. These compute classifiers by different approaches...
19 KB (2,431 words) - 15:33, 11 May 2025
Q–Q plot (category Wikipedia articles incorporating text from the National Institute of Standards and Technology)
distributions, providing a graphical view of how properties such as location, scale, and skewness are similar or different in the two distributions. Q–Q plots can...
21 KB (2,518 words) - 10:49, 4 July 2025
a test of normality. It was published in 1965 by Samuel Sanford Shapiro and Martin Wilk. The Shapiro–Wilk test tests the null hypothesis that a sample...
7 KB (793 words) - 14:08, 7 July 2025
Arithmetic mean (section Symbols and encoding)
In mathematics and statistics, the arithmetic mean ( /ˌærɪθˈmɛtɪk/ arr-ith-MET-ik), arithmetic average, or just the mean or average is the sum of a collection...
15 KB (2,142 words) - 04:49, 28 June 2025


