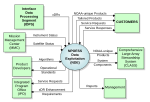
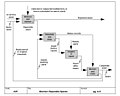
A system context diagram in engineering is a diagram that defines the boundary between the system, or part of a system, and its environment, showing the...
8 KB (958 words) - 01:35, 5 August 2024
A diagram is a symbolic representation of information using visualization techniques. Diagrams have been used since prehistoric times on walls of caves...
16 KB (1,060 words) - 21:09, 27 September 2024

Structured analysis (section Context diagram)
meet a system's functional requirements. De Marco's approach consists of the following objects (see figure): Context diagram Data flow diagram Process...
24 KB (2,863 words) - 21:53, 30 June 2024
A data-flow diagram is a way of representing a flow of data through a process or a system (usually an information system). The DFD also provides information...
13 KB (1,788 words) - 18:29, 11 August 2024

diagrams enable the visualization of bifurcation theory. In the context of discrete-time dynamical systems, the diagram is also called orbit diagram....
5 KB (594 words) - 20:31, 2 April 2024
environment and other actors. A system context diagram represents the context graphically.. Several examples of context models occur under other domains...
7 KB (800 words) - 18:55, 26 November 2023
Sudden cardiac death Superior canal dehiscence, of the inner ear System context diagram /dev/scd, SCSI audio-oriented optical disk drives Slowly changing...
2 KB (223 words) - 00:20, 6 November 2023

block diagram (FFBD) is a multi-tier, time-sequenced, step-by-step flow diagram of a system's functional flow. The term "functional" in this context is different...
12 KB (1,471 words) - 13:12, 7 February 2024
List of graphical methods (category Statistical charts and diagrams)
Information flow diagram IDEF N2 chart Sankey diagram State diagram System context diagram Data-flow diagram Map projection Orthographic projection (cartography)...
4 KB (331 words) - 07:28, 8 February 2024

Notation Information cascade Information systems NIAM / Object-role modeling System context diagram Systems thinking Wintraecken, J. J. V. R. (1990) [1987]...
9 KB (1,083 words) - 14:43, 22 January 2023
designer Matthew Steinke thought of a remedy and drew up a system context diagram. To allocate prices, Steinke wrote a formula based on rate of damage...
120 KB (9,584 words) - 23:51, 29 September 2024

and other finite reflection groups, and in other contexts. Various properties of the Dynkin diagram (such as whether it contains multiple edges, or its...
77 KB (5,608 words) - 07:05, 10 May 2024

Hatley–Pirbhai modeling (category Systems engineering)
should consist of a context diagram. The context diagram serves the purpose of "establish[ing] the information boundary between the system being implemented...
2 KB (214 words) - 17:02, 4 February 2024
Unified Modeling Language (redirect from UML Diagram)
of a system. UML provides a standard notation for many types of diagrams which can be roughly divided into three main groups: behavior diagrams, interaction...
26 KB (2,967 words) - 03:06, 27 September 2024

Structure chart (category Systems analysis)
engineering System context diagram Decomposition diagram Function model HIPO Structured Analysis and Design Technique Warnier/Orr diagram Work breakdown...
6 KB (700 words) - 00:35, 20 March 2024
architecture diagram of a PC Computer network diagram Internet diagram System context diagram In computer science more complex diagrams of computer networks...
6 KB (596 words) - 06:18, 11 August 2024

diagram is a widely used diagram style that shows the logical relation between sets, popularized by John Venn (1834–1923) in the 1880s. The diagrams are...
31 KB (3,260 words) - 00:08, 2 October 2024

In physics and engineering, a free body diagram (FBD; also called a force diagram) is a graphical illustration used to visualize the applied forces, moments...
17 KB (2,265 words) - 05:24, 13 September 2024
IDEF0 (category Systems analysis)
Level Context Diagram,” that defines the scope of the particular IDEF0 analysis. An example of a Top Level Context Diagram for an information system management...
14 KB (1,676 words) - 16:12, 9 September 2024

C4 model (category Diagrams)
hierarchical level: Context diagrams (level 1): show the system in scope and its relationship with users and other systems; Container diagrams (level 2): decompose...
6 KB (572 words) - 00:00, 6 January 2024
Facade pattern (section UML class and sequence diagram)
programming interface (API) provide a context-specific interface to more generic functionality (complete with context-specific input validation) serve as...
8 KB (798 words) - 14:53, 3 July 2024

N2 chart (redirect from N2 Diagram)
The N2 chart or N2 diagram (pronounced "en-two" or "en-squared") is a chart or diagram in the shape of a matrix, representing functional or physical interfaces...
8 KB (944 words) - 21:44, 13 May 2024

Event partitioning (category Systems analysis)
If you find a graphic to be helpful, create a context diagram showing the actors outside of the system under study and the flows/signals between them...
14 KB (1,226 words) - 02:51, 24 July 2024
reflection. In the above UML class diagram, the Context class does not implement an algorithm directly. Instead, Context refers to the Strategy interface...
10 KB (970 words) - 03:59, 8 September 2024
Decomposition (computer science) (redirect from Decomposition diagram)
well-defined steps. Structured analysis breaks down a software system from the system context level to system functions and data entities as described by Tom DeMarco...
4 KB (467 words) - 04:24, 23 May 2024
A bow-tie diagram is a graphic tool used to describe a possible damage process in terms of the mechanisms that may initiate an event in which energy is...
14 KB (1,626 words) - 15:01, 27 May 2024

Data model (redirect from Data model diagram)
represented in graphical form as diagrams. A data model can sometimes be referred to as a data structure, especially in the context of programming languages....
40 KB (5,059 words) - 23:27, 29 May 2024
Class diagram Component diagram Composite structure diagram Deployment diagram Object diagram Package diagram Profile diagram Behaviour diagrams are used...
9 KB (937 words) - 04:00, 8 March 2024

Object Process Methodology (redirect from Object Process Diagram)
The top-level OPD is the system diagram (SD), which provides the context for the system's function. For man-made systems this function is expected to...
69 KB (9,925 words) - 04:33, 31 July 2024

Cutaway drawing (redirect from Cutaway diagram)
A cutaway drawing, also called a cutaway diagram, is a 3D graphics, drawing, diagram and or illustration, in which surface elements of a three-dimensional...
6 KB (646 words) - 14:44, 12 July 2024