
A bar chart or bar graph is a chart or graph that presents categorical data with rectangular bars with heights or lengths proportional to the values that...
10 KB (1,282 words) - 07:46, 10 June 2024
represented by symbols, such as bars in a bar chart, lines in a line chart, or slices in a pie chart". A chart can represent tabular numeric data, functions...
13 KB (1,513 words) - 14:09, 21 July 2024
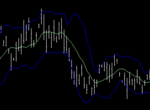
daily bar chart this would be the starting price for that day) on the left, and the closing price for that time period on the right. The bars may be...
3 KB (359 words) - 19:20, 20 July 2024

A Gantt chart is a bar chart that illustrates a project schedule. It was designed and popularized by Henry Gantt around the years 1910–1915. Modern Gantt...
18 KB (1,798 words) - 17:39, 7 June 2024

given pie chart, or to compare data across different pie charts. Pie charts can be replaced in most cases by other plots such as the bar chart, box plot...
21 KB (2,312 words) - 16:41, 7 June 2024
In industrial statistics, the X-bar chart is a type of Shewhart control chart that is used to monitor the arithmetic means of successive samples of constant...
2 KB (249 words) - 12:21, 17 December 2023

a security, derivative, or currency. While similar in appearance to a bar chart, each candlestick represents four important pieces of information for...
8 KB (1,013 words) - 01:52, 24 June 2024
takes out his frustrations by drinking alcohol at a bar and having fun. "A Bar Song (Tipsy)" charted at number one on Billboard's Hot Country Songs. As...
18 KB (1,288 words) - 22:39, 15 August 2024

percent of gross domestic product (GDP) by country. The first table and bar chart lists member countries of the Organisation for Economic Co-operation and...
27 KB (801 words) - 06:14, 22 March 2024
William Playfair (category Statistical charts and diagrams)
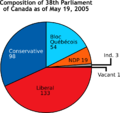
several types of diagrams: in 1786 the line, area and bar chart of economic data, and in 1801 the pie chart and circle graph, used to show part-whole relations...
19 KB (2,135 words) - 02:37, 27 June 2024

cascade; the chart portrays how an initial value is affected by a series of intermediate positive or negative values. Also, it is similar to Bar Graph. A...
4 KB (374 words) - 10:12, 26 July 2024
Histogram (category Statistical charts and diagrams)
a bar chart, each bar is for a different category of observations (e.g., each bar might be for a different population), so altogether the bar chart can...
26 KB (3,153 words) - 12:11, 10 August 2024
countries by total health expenditure per capita. The first table and bar chart lists member countries of the Organisation for Economic Co-operation and...
29 KB (728 words) - 18:49, 12 June 2024
Looker Studio (section Bar charts)
lines, bars, or a combination of the two. Another way to show how a metric changes over time is to utilize a time series chart. Time Series charts display...
17 KB (1,832 words) - 13:23, 4 August 2024
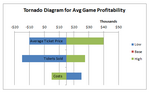
Tornado diagram (redirect from Tornado chart)
diagrams, also called tornado plots, tornado charts or butterfly charts, are a special type of Bar chart, where the data categories are listed vertically...
2 KB (238 words) - 21:02, 8 February 2024

chart is also known as web chart, spider chart, spider graph, spider web chart, star chart, star plot, cobweb chart, irregular polygon, polar chart,...
20 KB (2,497 words) - 06:58, 17 June 2024

control (SPC), the x ¯ {\displaystyle {\bar {x}}} and R chart is a type of scheme, popularly known as control chart, used to monitor the mean and range of...
6 KB (699 words) - 05:49, 21 May 2024

of a user to query and focus on specific numbers; while charts (e.g., bar charts or line charts), may help explain the quantitative messages contained...
86 KB (9,552 words) - 09:31, 30 July 2024
"Official Irish Albums Chart Top 50". Official Charts Company. Retrieved July 12, 2024. "Charts.nz – Zach Bryan – The Great American Bar Scene". Hung Medien...
15 KB (1,461 words) - 22:52, 31 July 2024
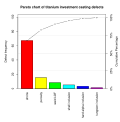
Pareto chart is a type of chart that contains both bars and a line graph, where individual values are represented in descending order by bars, and the...
4 KB (462 words) - 17:28, 17 July 2024
Data and information visualization (category Statistical charts and diagrams)
include tables, charts and graphs (e.g. pie charts, bar charts, line charts, area charts, cone charts, pyramid charts, donut charts, histograms, spectrograms...
86 KB (7,868 words) - 06:59, 14 July 2024
"Man Made a Bar" debuted at number 15 on the Billboard Hot 100 on the chart dated March 18, 2023. Wallen and Church performed "Man Made a Bar" live at the...
5 KB (286 words) - 16:09, 18 May 2024

Scatter plot (redirect from Scatter chart)
quantitative variables. A mosaic plot, fluctuation diagram, or faceted bar chart may be used to display two categorical variables. Other plots are used...
10 KB (1,063 words) - 14:10, 12 June 2024
by CJ E&M Music. "Bar Bar Bar" became a viral hit in late July, eventually reaching number one on Billboard's K-Pop Hot 100 chart and number three on...
24 KB (2,036 words) - 15:18, 28 May 2024
bars on an OHLC bar or candlestick chart (although simple line charts also work), starting as simple as a single bar, most often combined with chart formations...
56 KB (9,067 words) - 09:50, 24 April 2024
Dot plot (statistics) (redirect from Dot chart)
version is described by William S. Cleveland as an alternative to the bar chart, in which dots are used to depict the quantitative values (e.g. counts)...
4 KB (564 words) - 09:44, 26 May 2024

Control charts are graphical plots used in production control to determine whether quality and manufacturing processes are being controlled under stable...
32 KB (3,806 words) - 18:51, 7 June 2024
000 in vinculum form X-bar chart, a type of control chart This disambiguation page lists articles associated with the title X bar. If an internal link led...
369 bytes (80 words) - 20:25, 23 January 2024
Frequency (statistics) (section Bar graphs)
continuous. A bar chart or bar graph is a chart with rectangular bars with lengths proportional to the values that they represent. The bars can be plotted...
13 KB (1,584 words) - 22:59, 5 February 2024
Univariate (statistics) (section Bar charts)
(because it occurs 5 times in this data set). Bar chart is a graph consisting of rectangular bars. These bars actually represents number or percentage of...
12 KB (1,513 words) - 16:24, 14 June 2024