A diagram is a symbolic representation of information using visualization techniques. Diagrams have been used since prehistoric times on walls of caves...
16 KB (1,045 words) - 06:35, 5 March 2025

diagram is a widely used diagram style that shows the logical relation between sets, popularized by John Venn (1834–1923) in the 1880s. The diagrams are...
31 KB (3,242 words) - 13:31, 22 April 2025

The Hertzsprung–Russell diagram (abbreviated as H–R diagram, HR diagram or HRD) is a scatter plot of stars showing the relationship between the stars'...
23 KB (2,762 words) - 22:46, 23 April 2025

In theoretical physics, a Feynman diagram is a pictorial representation of the mathematical expressions describing the behavior and interaction of subatomic...
93 KB (15,967 words) - 06:48, 22 March 2025

Ishikawa diagrams (also called fishbone diagrams, herringbone diagrams, cause-and-effect diagrams) are causal diagrams created by Kaoru Ishikawa that...
11 KB (1,273 words) - 03:10, 14 April 2025

In mathematics, a Voronoi diagram is a partition of a plane into regions close to each of a given set of objects. It can be classified also as a tessellation...
46 KB (5,504 words) - 02:43, 25 March 2025

A phase diagram in physical chemistry, engineering, mineralogy, and materials science is a type of chart used to show conditions (pressure, temperature...
22 KB (2,517 words) - 20:50, 4 March 2025

another set diagramming technique, Venn diagrams. Unlike Venn diagrams, which show all possible relations between different sets, the Euler diagram shows only...
37 KB (3,628 words) - 02:03, 28 March 2025
A Cluster diagram or clustering diagram is a general type of diagram, which represents some kind of cluster. A cluster in general is a group or bunch of...
6 KB (596 words) - 06:18, 11 August 2024
diagram in Wiktionary, the free dictionary. A diagram is a symbolic representation of information using visualization techniques. Diagram or Diagrams...
516 bytes (98 words) - 13:56, 16 February 2024

spacetime diagram is a graphical illustration of locations in space at various times, especially in the special theory of relativity. Spacetime diagrams can...
49 KB (6,178 words) - 14:42, 23 March 2025
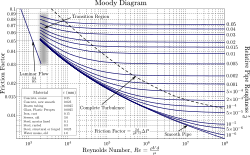
Moody chart (redirect from Moody diagram)
In engineering, the Moody chart or Moody diagram (also Stanton diagram) is a graph in non-dimensional form that relates the Darcy–Weisbach friction factor...
6 KB (860 words) - 13:50, 4 October 2024
Syntax diagrams (or railroad diagrams) are a way to represent a context-free grammar. They represent a graphical alternative to Backus–Naur form, EBNF...
5 KB (541 words) - 20:26, 2 January 2024

In software engineering, a sequence diagram shows process interactions arranged in time sequence. This diagram depicts the processes and objects involved...
7 KB (909 words) - 07:29, 5 March 2025

Sankey diagrams are a data visualisation technique or flow diagram that emphasizes flow/movement/change from one state to another or one time to another...
7 KB (733 words) - 19:17, 21 March 2025

In software engineering, a class diagram in the Unified Modeling Language (UML) is a type of static structure diagram that describes the structure of a...
19 KB (2,099 words) - 07:40, 5 March 2025
A Piping and Instrumentation Diagram (P&ID) is a detailed diagram in the process industry which shows process equipment together with the instrumentation...
13 KB (831 words) - 14:57, 10 January 2025
A data-flow diagram is a way of representing a flow of data through a process or a system (usually an information system). The DFD also provides information...
13 KB (1,790 words) - 07:11, 31 March 2025

in solution chemistry, a Pourbaix diagram, also known as a potential/pH diagram, EH–pH diagram or a pE/pH diagram, is a plot of possible thermodynamically...
28 KB (4,311 words) - 18:47, 21 April 2025

/ / and ⟨ ⟩, see IPA § Brackets and transcription delimiters. A vowel diagram or vowel chart is a schematic arrangement of the vowels. Depending on the...
7 KB (898 words) - 07:26, 5 March 2025
An influence diagram (ID) (also called a relevance diagram, decision diagram or a decision network) is a compact graphical and mathematical representation...
12 KB (1,467 words) - 19:40, 6 September 2024

A QAPF diagram is a doubled-triangle plot diagram used to classify intrusive igneous rocks based on their mineralogy. The acronym QAPF stands for "quartz...
7 KB (856 words) - 23:11, 14 March 2025

especially in category theory, a commutative diagram is a diagram such that all directed paths in the diagram with the same start and endpoints lead to the...
9 KB (1,123 words) - 10:21, 23 April 2025

mathematical study of Lie algebras and Lie groups, a Satake diagram is a generalization of a Dynkin diagram introduced by Satake (1960, p.109) whose configurations...
7 KB (912 words) - 04:56, 24 January 2025

Flow diagram is a diagram representing a flow or set of dynamic relationships in a system. The term flow diagram is also used as a synonym for flowchart...
4 KB (537 words) - 10:24, 22 February 2025

A block diagram is a diagram of a system in which the principal parts or functions are represented by blocks connected by lines that show the relationships...
6 KB (742 words) - 16:11, 22 October 2023
Tree diagram may refer to: Tree structure, a way of representing the hierarchical nature of a structure in a graphical form Tree diagram (probability...
2 KB (303 words) - 04:34, 10 September 2023

A deployment diagram "specifies constructs that can be used to define the execution architecture of systems and the assignment of software artifacts to...
2 KB (242 words) - 15:18, 22 November 2024

In solid-state physics of semiconductors, a band diagram is a diagram plotting various key electron energy levels (Fermi level and nearby energy band edges)...
10 KB (1,365 words) - 00:19, 17 March 2025
Dynkin diagram, named for Eugene Dynkin, is a type of graph with some edges doubled or tripled (drawn as a double or triple line). Dynkin diagrams arise...
78 KB (5,608 words) - 07:48, 7 March 2025