
Event chain diagrams are visualizations that show the relationships between events and tasks and how the events affect each other. Event chain diagrams...
9 KB (1,207 words) - 16:56, 4 October 2024
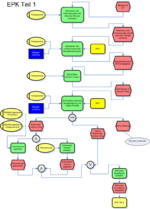
University of Saarland) in the early 1990s. Businesses use event-driven process chain diagrams to lay out business process workflows, originally in conjunction...
14 KB (1,970 words) - 22:18, 25 November 2024
activities. These are called "receiver" events. In turn, the receiver events can also act as sender events. Event chain diagram is a visualization that shows the...
17 KB (2,247 words) - 03:02, 6 January 2025

Gantt chart (category Diagrams)
software. Program evaluation and review technique (PERT) Progress bar Event chain diagram Project Management Institute 2021, Glossary §3 Definitions. Gantt...
18 KB (1,790 words) - 00:30, 24 January 2025

probability theory, a tree diagram may be used to represent a probability space. A tree diagram may represent a series of independent events (such as a set of...
2 KB (188 words) - 23:45, 2 May 2024
techniques. Event chain diagram : diagram that show the relationships between events and tasks and how the events affect each other. Event chain methodology...
34 KB (4,497 words) - 08:30, 21 January 2025
loggers below, or UI event handling, or servlet filters in Java, etc.) allow several elements in the chain to take responsibility. The Chain of Responsibility...
10 KB (1,208 words) - 11:31, 1 June 2024

diagram is a widely used diagram style that shows the logical relation between sets, popularized by John Venn (1834–1923) in the 1880s. The diagrams are...
31 KB (3,249 words) - 16:34, 31 January 2025

graph Data flow diagram Drakon-chart Event-driven process chain List of UML tools Pseudocode State diagram Flowchart Activity cycle diagram "Activities"...
5 KB (582 words) - 18:50, 23 February 2025
A diagram is a symbolic representation of information using visualization techniques. Diagrams have been used since prehistoric times on walls of caves...
15 KB (1,045 words) - 23:16, 23 January 2025
reference for new projects. Event chain diagram – diagram that show the relationships between events and tasks and how the events affect each other. Gantt...
23 KB (2,767 words) - 14:19, 12 December 2024

a Markov chain or Markov process is a stochastic process describing a sequence of possible events in which the probability of each event depends only...
96 KB (12,886 words) - 02:09, 6 February 2025
Swimlane (redirect from Swim lane diagram)
A swimlane (as in swimlane diagram) is used in process flow diagrams, or flowcharts, that visually distinguishes job sharing and responsibilities for...
5 KB (660 words) - 14:16, 28 July 2024
than the drag cost. Event chain diagrams are visualizations that show the relationships between events and tasks and how the events affect each other....
4 KB (557 words) - 20:10, 9 February 2024

The Hertzsprung–Russell diagram (abbreviated as H–R diagram, HR diagram or HRD) is a scatter plot of stars showing the relationship between the stars'...
23 KB (2,771 words) - 01:42, 18 July 2024
probability theory, the complement of any event A is the event [not A], i.e. the event that A does not occur. The event A and its complement [not A] are mutually...
4 KB (572 words) - 16:15, 10 November 2023

value chain diagram shows an overview of all activities within a company. Other business activities may be represented in "value stream diagrams" and/or...
14 KB (1,479 words) - 09:46, 24 February 2025
The Supply Chain Operations Reference (SCOR) model is a process reference model originally developed and endorsed by the Supply Chain Council, now a part...
22 KB (3,209 words) - 01:36, 7 October 2024
total probability of an outcome which can be realized via several distinct events, hence the name. The law of total probability is a theorem that states,...
6 KB (1,121 words) - 14:21, 19 August 2024
In probability theory, an elementary event, also called an atomic event or sample point, is an event which contains only a single outcome in the sample...
3 KB (439 words) - 07:27, 26 January 2025

relies "on arrow and node diagrams of activities and events: arrows represent the activities or work necessary to reach the events or nodes that indicate...
28 KB (3,861 words) - 05:25, 30 December 2024
elements). Since all events are sets, they are usually written as sets (for example, {1, 2, 3}), and represented graphically using Venn diagrams. In the situation...
8 KB (1,143 words) - 08:55, 14 January 2025

wrap the chain around it several times, but to wind it only partially over the wheel (Diagram 1). The design was supposed to engage the chain securely...
25 KB (3,396 words) - 19:33, 18 February 2025

discrete Expected value Variance Markov chain Observed value Random walk Stochastic process Complementary event Joint probability Marginal probability...
12 KB (1,377 words) - 00:06, 8 January 2025
{\displaystyle \Omega } , event space F {\displaystyle F} and probability measure P {\displaystyle P} . The probability of an event is a non-negative real...
11 KB (1,617 words) - 19:58, 3 February 2025
Process map (category Diagrams)
named process map in Visual Paradigm and MMABP, value-added chain in ARIS, and process diagram in Eriksson-Penker notation – which can easily lead to the...
15 KB (2,010 words) - 09:32, 28 March 2024
set of events is jointly or collectively exhaustive if at least one of the events must occur. For example, when rolling a six-sided die, the events 1, 2...
5 KB (693 words) - 17:37, 20 November 2024
An event tree is an inductive analytical diagram in which an event is analyzed using Boolean logic to examine a chronological series of subsequent events...
3 KB (364 words) - 00:46, 12 March 2023

A supply chain is a complex logistics system that consists of facilities that convert raw materials into finished products and distribute them to end...
46 KB (5,265 words) - 16:53, 30 January 2025

Business Process Model and Notation (category Diagrams)
business process diagrams (BPDs). BPDs also permit making new types of flow object or artifact, to make the diagram more understandable. Event Activity Gateway...
31 KB (3,213 words) - 04:04, 10 December 2024