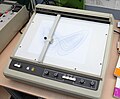
originally designed for plotter use, because in many uses, they offer a more efficient alternative to raster data. An X–Y plotter is a plotter that operates in...
20 KB (2,830 words) - 07:43, 11 September 2024
atomic motions Plotting board, a mechanical device to track a target and project its future position Conspiracy (disambiguation) Plotter (disambiguation)...
2 KB (285 words) - 04:12, 12 August 2024
Look up plotter in Wiktionary, the free dictionary. A plotter is a computer printer for printing vector graphics. Plotter may also refer to: Plotter (instrument)...
462 bytes (96 words) - 23:00, 6 June 2019

in World War II Sector clock at Uxbridge Ops Room Memoirs of plotter Joan Watkins Memoirs of plotter Janet Pieters/Hind The RAF Fighter Control System...
4 KB (473 words) - 11:06, 10 July 2023

Electromechanical Plotters Photo of Calcomp 565 plotter at Stuttgart Computer Museum Picture of a Calcomp 565 Calcomp 563 Incremental Plotter Information A...
4 KB (420 words) - 21:49, 25 February 2022

A Breton plotter (French: Rapporteur Breton), also known as a Portland course plotter or Weems protractor named after later manufacturers producing similar...
2 KB (257 words) - 12:53, 29 February 2024

The Yeoman Plotter was a plotter used on ships and boats to transfer GPS coordinates or RADAR echo locations onto a paper navigation chart and to read...
7 KB (1,058 words) - 00:38, 19 November 2023
electronic plotters: The parallel rulers plotter The triangle The Breton plotter Yeoman plotter Course (navigation) "Plotting course with a plotter". Archived...
1 KB (73 words) - 04:51, 29 March 2023
An electrostatic plotter is a type of plotter that draws images on paper with an electrostatic process. They are most frequently used for Computer-Aided...
2 KB (344 words) - 13:46, 6 February 2024

open-loop amplifier AOL. The phase margin in this amplifier is 45°. The Bode plotter is an electronic instrument resembling an oscilloscope, which produces...
31 KB (4,710 words) - 10:24, 21 September 2024
Plotter Kill may refer to Plotter Kill (Mohawk River) – a tributary of the Mohawk River Plotter Kill Preserve – a nature preserve in Rotterdam, New York...
189 bytes (57 words) - 00:38, 5 June 2020

A polar plotter also known as polargraph or Kritzler is a plotter which uses two-center bipolar coordinates to produce vector drawings using a pen suspended...
2 KB (185 words) - 17:27, 15 February 2023

The Gunpowder Plot of 1605, in earlier centuries often called the Gunpowder Treason Plot or the Jesuit Treason, was an unsuccessful attempted regicide...
102 KB (13,019 words) - 17:03, 7 October 2024
Plotly is a technical computing company headquartered in Montreal, Quebec, that develops online data analytics and visualization tools. Plotly provides...
21 KB (1,262 words) - 19:20, 27 September 2024
A plot device or plot mechanism is any technique in a narrative used to move the plot forward. A clichéd plot device may annoy the reader and a contrived...
14 KB (1,782 words) - 16:01, 19 September 2024

Robert Plot (13 December 1640 – 30 April 1696) was an English naturalist and antiquarian who was the first professor of chemistry at the University of...
7 KB (793 words) - 23:58, 4 July 2024

A Manhattan plot is a type of plot, usually used to display data with a large number of data-points, many of non-zero amplitude, and with a distribution...
2 KB (193 words) - 16:12, 17 May 2024
"Quantile-Quantile" plot Normal probability plot, a Q–Q plot against the standard normal distribution Probability plot correlation coefficient Probability plot correlation...
414 bytes (81 words) - 21:52, 22 September 2020

Graph of a function Line chart List of graphical methods Plotting software Plotter List of plotting programs This article incorporates public domain material...
20 KB (2,642 words) - 08:44, 28 July 2024

In descriptive statistics, a box plot or boxplot is a method for demonstrating graphically the locality, spread and skewness groups of numerical data through...
20 KB (2,994 words) - 11:13, 28 June 2024

The Ridolfi plot was a Catholic plot in 1571 to overthrow Queen Elizabeth I of England and replace her with Mary, Queen of Scots. The plot was hatched...
16 KB (2,098 words) - 08:50, 2 October 2024

Wikimedia Commons has media related to Forest plots. A forest plot, also known as a blobbogram, is a graphical display of estimated results from a number...
10 KB (1,237 words) - 02:29, 10 October 2023

the plot is the sequence of events in which each event affects the next one through the principle of cause-and-effect. The causal events of a plot can...
29 KB (3,389 words) - 10:53, 4 October 2024

The Bojinka plot (Arabic: بوجينكا; Tagalog: Proyektong Bojinka) was a large-scale, three-phase terrorist attack planned by Ramzi Yousef and Khalid Sheikh...
45 KB (5,474 words) - 18:44, 24 September 2024
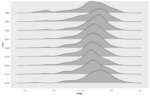
A ridgeline plot (formerly known as a joyplot) is a series of line plots that are combined by vertical stacking to allow the easy visualization of changes...
2 KB (161 words) - 03:45, 2 August 2024
Sh! The Octopus (section Plot)
as Sinister plotter Frank Hagney as Sinister plotter Ed Biby as Sinister plotter Molly Doyle as Nurse Jack Jorgensen as Sinister plotter In 2010, the...
4 KB (266 words) - 12:00, 9 October 2024
A Poincaré plot, named after Henri Poincaré, is a graphical representation used to visualize the relationship between consecutive data points in time series...
7 KB (885 words) - 09:15, 7 October 2024

multivariate statistics, a scree plot is a line plot of the eigenvalues of factors or principal components in an analysis. The scree plot is used to determine the...
4 KB (442 words) - 11:22, 16 July 2024

statistics, a Q–Q plot (quantile–quantile plot) is a probability plot, a graphical method for comparing two probability distributions by plotting their quantiles...
21 KB (2,478 words) - 00:12, 3 August 2024

In orbital mechanics, a porkchop plot (also pork-chop plot) is a chart that shows level curves of equal characteristic energy (C3) against combinations...
4 KB (373 words) - 21:26, 18 April 2024