
 French
 Deutsch
Datei:Landkreis Muenchen Bevoelkerungsentwicklung.svg – Wikipedia

Größe der PNG-Vorschau dieser SVG-Datei: 800 × 400 Pixel. Weitere aus SVG automatisch erzeugte PNG-Grafiken in verschiedenen Auflösungen: 320 × 160 Pixel | 640 × 320 Pixel | 1.024 × 512 Pixel | 1.280 × 640 Pixel | 2.560 × 1.280 Pixel
Originaldatei (SVG-Datei, Basisgröße: 800 × 400 Pixel, Dateigröße: 33 KB)
![]()
Diese Datei und die Informationen unter dem roten Trennstrich werden aus dem zentralen Medienarchiv Wikimedia Commons eingebunden.
![]()
Beschreibung
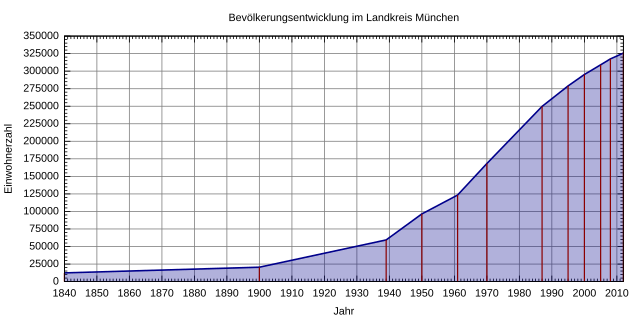
| Beschreibung | Deutsch: Bevölkerungsentwicklung im Landkreis München seit 1840. Datenquelle: [1] English: Population development in Landkreis Munich since 1840. Data source: [2] |
| Datum | |
| Quelle | Eigenes Werk |
| Urheber | Michael Fiedler |
Lizenz
Ich, der Urheber dieses Werkes, veröffentliche es unter der folgenden Lizenz:
Diese Datei ist unter der Creative-Commons-Lizenz „Namensnennung – Weitergabe unter gleichen Bedingungen 3.0 nicht portiert“ lizenziert.
- Dieses Werk darf von dir
- verbreitet werden – vervielfältigt, verbreitet und öffentlich zugänglich gemacht werden
- neu zusammengestellt werden – abgewandelt und bearbeitet werden
- Zu den folgenden Bedingungen:
- Namensnennung – Du musst angemessene Urheber- und Rechteangaben machen, einen Link zur Lizenz beifügen und angeben, ob Änderungen vorgenommen wurden. Diese Angaben dürfen in jeder angemessenen Art und Weise gemacht werden, allerdings nicht so, dass der Eindruck entsteht, der Lizenzgeber unterstütze gerade dich oder deine Nutzung besonders.
- Weitergabe unter gleichen Bedingungen – Wenn du das Material wiedermischst, transformierst oder darauf aufbaust, musst du deine Beiträge unter der gleichen oder einer kompatiblen Lizenz wie das Original verbreiten.
Gnuplot script to generate this plot
#!/usr/bin/gnuplot # gnuplot 4.6 / Debian 7 # # Erstellt von Michael Fiedler <[email protected]> # Lizenz: CC-BY-SA 3.0 unported, https://creativecommons.org/licenses/by-sa/3.0/deed.de # Basierend auf http://commons.wikimedia.org/wiki/File:Muc_population.svg von Gorgo set title 'Bevölkerungsentwicklung im Landkreis München' unset key set style fill transparent solid 0.3 set grid set xlabel 'Jahr' set xrange [1840:2012] # Jahreszahl alle 10 Jahre set xtics 10 # nochmal unterteilen set mxtics 10 set ylabel 'Einwohnerzahl' # Beschriftungsintervall set ytics 25000 # weitere Unterteilung ohne Beschriftung set mytics 5 set yrange ['0':'350000'] set terminal svg size 800,400 font 'Arial,10' set output 'Landkreis_Muenchen_Bevoelkerungsentwicklung.svg' # '-' nimmt die nachfolgenden Daten als Eingabewerte plot '-' using 1:2 with filledcurves below x1 linetype rgb 'dark-blue' linewidth 2, \ '-' using 1:2 with impulses linecolor rgbcolor 'dark-red' linewidth 1.5 # Datenquelle: http://de.wikipedia.org/wiki/Landkreis_München 1840 12393 1900 20521 1939 59377 1950 96475 1961 123369 1970 168336 1987 249784 1995 279007 2000 295247 2005 309080 2008 317543 2012 325744 EOF 1840 12393 1900 20521 1939 59377 1950 96475 1961 123369 1970 168336 1987 249784 1995 279007 2000 295247 2005 309080 2008 317543 2012 325744 EOF Dateiversionen
Klicke auf einen Zeitpunkt, um diese Version zu laden.
| Version vom | Vorschaubild | Maße | Benutzer | Kommentar | |
|---|---|---|---|---|---|
| aktuell | 19:31, 23. Mär. 2014 | | 800 × 400 (33 KB) | Simified | User created page with UploadWizard |
Dateiverwendung
Die folgende Seite verwendet diese Datei: