1954 United States Senate elections
| ||||||||||||||||||||||||||||||||||||||||||||||||||||||||||||||||||||
38 of the 96 seats in the United States Senate 49 seats needed for a majority | ||||||||||||||||||||||||||||||||||||||||||||||||||||||||||||||||||||
|---|---|---|---|---|---|---|---|---|---|---|---|---|---|---|---|---|---|---|---|---|---|---|---|---|---|---|---|---|---|---|---|---|---|---|---|---|---|---|---|---|---|---|---|---|---|---|---|---|---|---|---|---|---|---|---|---|---|---|---|---|---|---|---|---|---|---|---|---|
| ||||||||||||||||||||||||||||||||||||||||||||||||||||||||||||||||||||
 | ||||||||||||||||||||||||||||||||||||||||||||||||||||||||||||||||||||
The 1954 United States Senate elections was a midterm election in the first term of Dwight D. Eisenhower's presidency. The 32 Senate seats of Class 2 were contested in regular elections, and six special elections were held to fill vacancies. Eisenhower's Republican party lost a net of two seats to the Democratic opposition. This small change was just enough to give Democrats control of the chamber with the help of the Independent (Wayne Morse of Oregon) who at the start of this Congress in January 1955 agreed to caucus with them; he later officially joined the party in April 1955.
The elections resulted in a divided government that continued to the end of Eisenhower's presidency and a Democratic majority that would last until 1981. As of 2022[update], this is the last Senate election cycle in which a state (both Nebraska and North Carolina) had to hold three simultaneous elections (two special elections and one regular election) due to the near-simultaneous deaths of both incumbent Senators.
Results summary
[edit]| 48 | 1 | 47 |
| Democratic | I | Republican |
Colored shading indicates party with largest share of that row.
| Parties | Total | ||||||||||||||||||||||||||||||||||||||||||||||||||||||||||||||||||||||||||||||||||||||||||||||||||
|---|---|---|---|---|---|---|---|---|---|---|---|---|---|---|---|---|---|---|---|---|---|---|---|---|---|---|---|---|---|---|---|---|---|---|---|---|---|---|---|---|---|---|---|---|---|---|---|---|---|---|---|---|---|---|---|---|---|---|---|---|---|---|---|---|---|---|---|---|---|---|---|---|---|---|---|---|---|---|---|---|---|---|---|---|---|---|---|---|---|---|---|---|---|---|---|---|---|---|---|
| Democratic | Republican | Independent | Other | ||||||||||||||||||||||||||||||||||||||||||||||||||||||||||||||||||||||||||||||||||||||||||||||||
| Last elections (1952) | 47 | 49 | 0 | 0 | 96 | ||||||||||||||||||||||||||||||||||||||||||||||||||||||||||||||||||||||||||||||||||||||||||||||
| Before these elections | 46 | 49 | 1 | 0 | 96 | ||||||||||||||||||||||||||||||||||||||||||||||||||||||||||||||||||||||||||||||||||||||||||||||
| Not up | 24 | 33 | 0 | 1 | 58 | ||||||||||||||||||||||||||||||||||||||||||||||||||||||||||||||||||||||||||||||||||||||||||||||
| Up | 22 | 16 | 0 | — | 38 | ||||||||||||||||||||||||||||||||||||||||||||||||||||||||||||||||||||||||||||||||||||||||||||||
| Class 2 (1948→1954) | 20 | 12 | — | — | 32 | ||||||||||||||||||||||||||||||||||||||||||||||||||||||||||||||||||||||||||||||||||||||||||||||
| Special: Class 1 | 0 | 1 | — | — | 1 | ||||||||||||||||||||||||||||||||||||||||||||||||||||||||||||||||||||||||||||||||||||||||||||||
| Special: Class 3 | 2 | 3 | — | — | 5 | ||||||||||||||||||||||||||||||||||||||||||||||||||||||||||||||||||||||||||||||||||||||||||||||
| Incumbent retired | 2 | 4 | — | — | 6 | ||||||||||||||||||||||||||||||||||||||||||||||||||||||||||||||||||||||||||||||||||||||||||||||
| Held by same party | 1 | 3 | — | — | 4 | ||||||||||||||||||||||||||||||||||||||||||||||||||||||||||||||||||||||||||||||||||||||||||||||
| Replaced by other party | — | — | 2 | ||||||||||||||||||||||||||||||||||||||||||||||||||||||||||||||||||||||||||||||||||||||||||||||||
| Result | 2 | 4 | 0 | 0 | 6 | ||||||||||||||||||||||||||||||||||||||||||||||||||||||||||||||||||||||||||||||||||||||||||||||
| Incumbent ran | 20 | 12 | — | — | 32 | ||||||||||||||||||||||||||||||||||||||||||||||||||||||||||||||||||||||||||||||||||||||||||||||
| Won re-election | 17 | 7 | — | — | 24 | ||||||||||||||||||||||||||||||||||||||||||||||||||||||||||||||||||||||||||||||||||||||||||||||
| Lost re-election | — | — | 6 | ||||||||||||||||||||||||||||||||||||||||||||||||||||||||||||||||||||||||||||||||||||||||||||||||
| Lost renomination but held by same party | 1 | 1 | — | — | 2 | ||||||||||||||||||||||||||||||||||||||||||||||||||||||||||||||||||||||||||||||||||||||||||||||
| Result | 22 | 10 | 0 | 0 | 32 | ||||||||||||||||||||||||||||||||||||||||||||||||||||||||||||||||||||||||||||||||||||||||||||||
| Total elected | 24 | 14 | 0 | 0 | 38 | ||||||||||||||||||||||||||||||||||||||||||||||||||||||||||||||||||||||||||||||||||||||||||||||
| Net change | 2 | ||||||||||||||||||||||||||||||||||||||||||||||||||||||||||||||||||||||||||||||||||||||||||||||||||
| Nationwide vote | 15,137,069 | 12,585,368 | 35,661 | 323,147 | 28,081,245 | ||||||||||||||||||||||||||||||||||||||||||||||||||||||||||||||||||||||||||||||||||||||||||||||
| Share | 53.90% | 44.82% | 0.13% | 1.15% | 100% | ||||||||||||||||||||||||||||||||||||||||||||||||||||||||||||||||||||||||||||||||||||||||||||||
| Result | 48 | 47 | 1 | 0 | 96 | ||||||||||||||||||||||||||||||||||||||||||||||||||||||||||||||||||||||||||||||||||||||||||||||
Source: Clerk of the U.S. House of Representatives[1]
Gains, losses and holds
[edit]Retirements
[edit]One Republican and one Democrat retired instead of seeking re-election. Two Republicans and one Democrat also retired instead of finishing the unexpired term.
Defeats
[edit]Three Republicans and two Democrats sought re-election, and two Republicans and one Democrat also sought election to finish the unexpired term, but lost in the primary or general election.
Party entrance
[edit]Wayne Morse (I-OR) who caucused with the Democrats, officially joined the party in April 1955.
| State | Senator | Replaced by |
|---|---|---|
| Oregon | Wayne Morse | Wayne Morse |
Post-election changes
[edit]| State | Senator | Replaced by |
|---|---|---|
| Kentucky | Alben W. Barkley | Robert Humphreys |
| South Carolina | Strom Thurmond | Thomas A. Wofford |
| West Virginia | Harley M. Kilgore | William Laird III |
Change in composition
[edit]Before the elections
[edit]| D1 | D2 | D3 | D4 | D5 | D6 | D7 | D8 | ||
| D18 | D17 | D16 | D15 | D14 | D13 | D12 | D11 | D10 | D9 |
| D19 | D20 | D21 | D22 | D23 | D24 | D25 Ala. Ran | D26 Ark. Ran | D27 Colo. Retired | D28 Del. Ran |
| D38 N.C. (sp 3) Ran | D37 N.C. (reg) N.C. (sp 2) Ran | D36 N.M. Ran | D35 Mont. Ran | D34 Miss. Ran | D33 Minn. Ran | D32 La. Ran | D31 Iowa Ran | D30 Ill. Ran | D29 Ga. Ran |
| D39 Ohio (sp) Ran | D40 Okla. Ran | D41 R.I. Ran | D42 S.C. Retired | D43 Tenn. Ran | D44 Texas Ran | D45 Va. Ran | D46 W.Va. Ran | I1 | R49 Wyo. (reg) Wyo. (sp) Retired |
| Majority → | |||||||||
| R39 Mass. Ran | R40 Mich. Ran | R41 Neb. (reg) Neb. (sp 2) Retired | R42 Neb. (sp 1) Retired | R43 Nev. (sp) Ran | R44 N.H. (reg) Ran | R45 N.H. (sp) Ran | R46 N.J. Retired | R47 Ore. Ran | R48 S.D. Ran |
| R38 Me. Ran | R37 Ky. Ran | R36 Kan. Ran | R35 Idaho Ran | R34 Calif. (sp) Ran | R33 | R32 | R31 | R30 | R29 |
| R19 | R20 | R21 | R22 | R23 | R24 | R25 | R26 | R27 | R28 |
| R18 | R17 | R16 | R15 | R14 | R13 | R12 | R11 | R10 | R9 |
| R1 | R2 | R3 | R4 | R5 | R6 | R7 | R8 | ||
Results of the elections
[edit]| D1 | D2 | D3 | D4 | D5 | D6 | D7 | D8 | ||
| D18 | D17 | D16 | D15 | D14 | D13 | D12 | D11 | D10 | D9 |
| D19 | D20 | D21 | D22 | D23 | D24 | D25 Ala. Re-elected | D26 Ark. Re-elected | D27 Del. Re-elected | D28 Ga. Re-elected |
| D38 R.I. Re-elected | D37 Okla. Re-elected | D36 N.C. (sp 3) Elected[c] | D35 N.C. (reg) N.C. (sp 2) Hold | D34 N.M. Re-elected | D33 Mont. Re-elected | D32 Miss. Re-elected | D31 Minn. Re-elected | D30 La. Re-elected | D29 Ill. Re-elected |
| D39 S.C. Hold | D40 Tenn. Re-elected | D41 Texas Re-elected | D42 Va. Re-elected | D43 W.Va. Re-elected | D44 Ky. Gain | D45 Mich. Gain | D46 Nev. (sp) Gain[d] | D47 Ore. Gain | D48 Wyo. (reg) Wyo. (sp) Gain |
| Majority with Independent in caucus ↑ | I1 | ||||||||
| R39 Neb. (sp 2) Hold Neb. (reg) Hold | R40 Neb. (sp 1) Hold | R41 N.H. (reg) Re-elected | R42 N.H. (sp) Hold | R43 N.J. Hold | R44 S.D. Re-elected | R45 Colo. Gain | R46 Iowa Gain | R47 Ohio (sp) Gain[d] | |
| R38 Mass. Re-elected | R37 Me. Re-elected | R36 Kan. Re-elected | R35 Idaho Re-elected | R34 Calif. (sp) Elected[c] | R33 | R32 | R31 | R30 | R29 |
| R19 | R20 | R21 | R22 | R23 | R24 | R25 | R26 | R27 | R28 |
| R18 | R17 | R16 | R15 | R14 | R13 | R12 | R11 | R10 | R9 |
| R1 | R2 | R3 | R4 | R5 | R6 | R7 | R8 | ||
| Key: |
|
|---|
Race summaries
[edit]Special elections during the 83rd Congress
[edit]In these special elections, the winners were seated during 1954 or before January 3, 1955; ordered by election date, then state, then class.
| State | Incumbent | Results | Candidates | ||
|---|---|---|---|---|---|
| Senator | Party | Electoral history | |||
| California (Class 3) | Thomas Kuchel | Republican | 1953 (Appointed) | Interim appointee elected November 2, 1954. |
|
| Nebraska (Class 1) | Samuel W. Reynolds | Republican | 1954 (Appointed) | Interim appointee retired. New senator elected November 2, 1954. Republican hold. |
|
| Nebraska (Class 2) | Eva Bowring | Republican | 1954 (Appointed) | Interim appointee retired. New senator elected November 2, 1954. Winner was not elected to the next term; see below. Republican hold. |
|
| Nevada (Class 3) | Ernest S. Brown | Republican | 1954 (Appointed) | Interim appointee lost election. New senator elected November 2, 1954. Democratic gain. |
|
| New Hampshire (Class 3) | Robert W. Upton | Republican | 1953 (Appointed) | Interim appointee lost nomination. New senator elected November 2, 1954. Republican hold. |
|
| North Carolina (Class 2) | Alton Lennon | Democratic | 1953 (Appointed) | Interim appointee lost nomination. New senator elected November 2, 1954. Democratic hold. Winner also elected to next term; see below. |
|
| North Carolina (Class 3) | Sam Ervin | Democratic | 1954 (Appointed) | Interim appointee elected November 2, 1954. |
|
| Ohio (Class 3) | Thomas A. Burke | Democratic | 1953 (Appointed) | Interim appointee lost election. New senator elected November 2, 1954. Republican gain. |
|
| Wyoming (Class 2) | Edward D. Crippa | Republican | 1954 (Appointed) | Interim appointee retired. New senator elected November 2, 1954. Winner also elected to the next term; see below. Democratic gain. |
|
Races leading to the 84th Congress
[edit]In these general elections, the winner was seated on January 3, 1955; ordered by state.
All of the elections involved the Class 2 seats.
| State | Incumbent | Results | Candidates | ||
|---|---|---|---|---|---|
| Senator | Party | Electoral history | |||
| Alabama | John Sparkman | Democratic | 1946 (special) 1948 | Incumbent re-elected. |
|
| Arkansas | John L. McClellan | Democratic | 1942 1948 | Incumbent re-elected. |
|
| Colorado | Edwin C. Johnson | Democratic | 1936 1942 1948 | Incumbent retired to run for Governor. Republican gain. |
|
| Delaware | J. Allen Frear Jr. | Democratic | 1948 | Incumbent re-elected. |
|
| Georgia | Richard Russell Jr. | Democratic | 1932 (special) 1936 1942 1948 | Incumbent re-elected. |
|
| Idaho | Henry Dworshak | Republican | 1946 (special) 1948 (Lost) 1949 (Appointed) 1950 (special) | Incumbent re-elected. |
|
| Illinois | Paul Douglas | Democratic | 1948 | Incumbent re-elected. |
|
| Iowa | Guy Gillette | Democratic | 1936 (special) 1938 1944 (Lost) 1948 | Incumbent lost re-election. Republican gain. |
|
| Kansas | Andrew Frank Schoeppel | Republican | 1948 | Incumbent re-elected. |
|
| Kentucky | John Sherman Cooper | Republican | 1946 (special) 1948 (Lost) 1952 (special) | Incumbent lost re-election. Democratic gain. |
|
| Louisiana | Allen J. Ellender | Democratic | 1936 1942 1948 | Incumbent re-elected. |
|
| Maine | Margaret Chase Smith | Republican | 1948 | Incumbent re-elected. |
|
| Massachusetts | Leverett Saltonstall | Republican | 1944 (special) 1948 | Incumbent re-elected. |
|
| Michigan | Homer S. Ferguson | Republican | 1942 1948 | Incumbent lost re-election. Democratic gain. |
|
| Minnesota | Hubert Humphrey | DFL | 1948 | Incumbent re-elected. |
|
| Mississippi | James Eastland | Democratic | 1942 1948 | Incumbent re-elected. |
|
| Montana | James E. Murray | Democratic | 1934 (special) 1936 1942 1948 | Incumbent re-elected. |
|
| Nebraska | Eva Bowring | Republican | 1954 (special) | Interim appointee retired. Republican hold. Winner was not elected to finish the term; see above. Successor seated January 1, 1955. |
|
| New Hampshire | Styles Bridges | Republican | 1936 1942 1948 | Incumbent re-elected. |
|
| New Jersey | Robert C. Hendrickson | Republican | 1948 | Incumbent retired. Republican hold. |
|
| New Mexico | Clinton Anderson | Democratic | 1948 | Incumbent re-elected. |
|
| North Carolina | Alton Lennon | Democratic | 1953 (Appointed) | Interim appointee lost nomination. Democratic hold. Winner also elected to finish the term; see above. |
|
| Oklahoma | Robert S. Kerr | Democratic | 1948 | Incumbent re-elected. |
Others
|
| Oregon | Guy Cordon | Republican | 1944 (Appointed) 1944 (special) 1948 | Incumbent lost re-election. Democratic gain. |
|
| Rhode Island | Theodore F. Green | Democratic | 1936 1942 1948 | Incumbent re-elected. |
|
| South Carolina | Charles E. Daniel | Democratic | 1954 (Appointed) | Interim appointee retired. Democratic hold. Incumbent then resigned December 23, 1954, to give successor preferential seniority. Winner appointed December 24 to finish the term. |
|
| South Dakota | Karl Mundt | Republican | 1948 1948 (Appointed) | Incumbent re-elected. |
|
| Tennessee | Estes Kefauver | Democratic | 1948 | Incumbent re-elected. |
|
| Texas | Lyndon B. Johnson | Democratic | 1948 | Incumbent re-elected. |
|
| Virginia | A. Willis Robertson | Democratic | 1946 (special) 1948 | Incumbent re-elected. |
|
| West Virginia | Matthew M. Neely | Democratic | 1922 1928 (Lost) 1930 1936 1941 (Resigned) 1948 | Incumbent re-elected. |
|
| Wyoming | Edward D. Crippa | Republican | 1954 (Appointed) | Interim appointee retired. Democratic gain. Winner also elected to finish the term; see above. |
|
Closest races
[edit]Twelve races had a margin of victory under 10%:
| State | Party of winner | Margin |
|---|---|---|
| Ohio (special) | Republican (flip) | 0.12% |
| New Jersey | Republican | 0.19% |
| Oregon | Democratic (flip) | 0.4%[e] |
| Montana | Democratic | 0.8% |
| Massachusetts | Republican | 1.5% |
| Michigan | Democratic (flip) | 1.9% |
| Colorado | Republican (flip) | 2.6% |
| Wyoming | Democratic (flip) | 3.2% |
| Iowa | Republican (flip) | 4.7% |
| California (special) | Republican | 7.7% |
| Kentucky | Democratic (flip) | 9.0% |
| West Virginia | Democratic | 9.6% |
Alabama
[edit]
| |||||||||||||||||
| |||||||||||||||||
 County results Sparkman: 50–60% 60–70% 70–80% 80–90% >90% | |||||||||||||||||
| |||||||||||||||||
| Party | Candidate | Votes | % | |
|---|---|---|---|---|
| Democratic | John Sparkman (Incumbent) | 259,348 | 82.47 | |
| Republican | J. Foy Guin Jr. | 55,110 | 17.53 | |
| Majority | 204,438 | 64.96 | ||
| Turnout | 314,458 | |||
| Democratic hold | ||||
Arkansas
[edit]
| |||||||||||||||||
| |||||||||||||||||
 County results McClellan: 40–50% 50–60% 60–70% 70–80% 80–90% McMath: 40–50% 50–60% 60–70% 70–80% 80–90% | |||||||||||||||||
| |||||||||||||||||
| Party | Candidate | Votes | % | |
|---|---|---|---|---|
| Democratic | John L. McClellan (Incumbent) | 291,058 | 100.00 | |
| Democratic hold | ||||
California (special)
[edit]
| |||||||||||||||||
| |||||||||||||||||
 County results: Thomas Kuchel: 50-60% 60-70% 70-80% Sam Yorty: 50-60% | |||||||||||||||||
| |||||||||||||||||
Following the resignation of Richard Nixon to assume the vice presidency, Governor Earl Warren appointed Thomas Kuchel to Nixon's seat; Kuchel assumed the office on January 2, 1953.[3]
| Party | Candidate | Votes | % | |
|---|---|---|---|---|
| Republican | Thomas Kuchel (Incumbent) | 2,090,836 | 53.2 | |
| Democratic | Sam Yorty | 1,788,071 | 45.5 | |
| Independent–Progressive | Isobel M. Cerney | 50,506 | 1.3 | |
| None | Scattering | 255 | 0.00 | |
| Majority | 302,765 | 7.7 | ||
| Turnout | 3,929,668 | |||
| Republican hold | ||||
Colorado
[edit]
| |||||||||||||||||
| |||||||||||||||||
 County results Allott: 50–60% 60–70% Carroll: 50–60% 60–70% | |||||||||||||||||
| |||||||||||||||||
| Party | Candidate | Votes | % | |
|---|---|---|---|---|
| Republican | Gordon Allott | 248,502 | 51.32 | |
| Democratic | John A. Carroll | 235,686 | 48.68 | |
| Majority | 12,816 | 2.64 | ||
| Turnout | 484,188 | |||
| Republican gain from Democratic | ||||
Delaware
[edit]
| |||||||||||||||||
| |||||||||||||||||
 County results Frear: 50–60% 60–70% | |||||||||||||||||
| |||||||||||||||||
| Party | Candidate | Votes | % | |
|---|---|---|---|---|
| Democratic | J. Allen Frear (Incumbent) | 82,511 | 56.94 | |
| Republican | Herbert B. Warburton | 62,389 | 43.06 | |
| Majority | 20,122 | 13.88 | ||
| Turnout | 144,900 | |||
| Democratic hold | ||||
Georgia
[edit]
| ||||||||||||||||||||
| ||||||||||||||||||||
 County results Russell: >90% | ||||||||||||||||||||
| ||||||||||||||||||||
| Party | Candidate | Votes | % | |
|---|---|---|---|---|
| Democratic | Richard B. Russell (Incumbent) | 333,917 | 99.99 | |
| None | Scattering | 19 | 0.01 | |
| Majority | 333,898 | 99.98 | ||
| Turnout | 333,936 | |||
| Democratic hold | ||||
Idaho
[edit]
| |||||||||||||||||
 County results Dworshak: 50–60% 60–70% 70–80% Taylor: 50–60% 60–70% | |||||||||||||||||
| |||||||||||||||||
In Idaho, Republican Incumbent Henry Dworshak defeated Glen H. Taylor, who had previously represented Idaho in the Senate from 1945 to 1951. Allegations of Communist ties were used against Taylor by Dworshak and other Republicans to win the election.[4]
| Party | Candidate | Votes | % | |
|---|---|---|---|---|
| Republican | Henry Dworshak (Incumbent) | 142,269 | 62.84% | |
| Democratic | Glen H. Taylor | 84,139 | 37.16% | |
| Majority | 58,130 | 25.68% | ||
| Turnout | 226,408 | |||
| Republican hold | ||||
Illinois
[edit]
| |||||||||||||||||
| Turnout | 63.69% | ||||||||||||||||
|---|---|---|---|---|---|---|---|---|---|---|---|---|---|---|---|---|---|
| |||||||||||||||||
 County results Douglas: 50–60% 60–70% Meeks: 50–60% 60–70% 70–80% | |||||||||||||||||
| |||||||||||||||||
| Party | Candidate | Votes | % | |
|---|---|---|---|---|
| Democratic | Paul H. Douglas (Incumbent) | 1,804,338 | 53.57 | |
| Republican | Joseph T. Meek | 1,563,683 | 46.43 | |
| Majority | 240,655 | 7.14 | ||
| Turnout | 3,368,021 | |||
| Democratic hold | ||||
Iowa
[edit]
| |||||||||||||||||
| |||||||||||||||||
 County results Martin: 50–60% 60–70% 70–80% Gillette: 50–60% 60–70% Tie: 40–50% | |||||||||||||||||
| |||||||||||||||||
| Party | Candidate | Votes | % | |
|---|---|---|---|---|
| Republican | Thomas E. Martin | 442,409 | 52.21 | |
| Democratic | Guy Gillette (Incumbent) | 402,712 | 47.53 | |
| Republicsons | Ernest Seeman | 2,234 | 0.26 | |
| Majority | 39,697 | 4.68 | ||
| Turnout | 847,355 | |||
| Republican gain from Democratic | ||||
Kansas
[edit]
| |||||||||||||||||
| |||||||||||||||||
 County results Schoeppel: 40–50% 50–60% 60–70% 70–80% McGill: 50–60% | |||||||||||||||||
| |||||||||||||||||
| Party | Candidate | Votes | % | |
|---|---|---|---|---|
| Republican | Andrew Schoeppel (Incumbent) | 348,144 | 56.33 | |
| Democratic | George McGill | 258,575 | 41.84 | |
| Prohibition | David C. White | 11,344 | 1.84 | |
| Majority | 89,569 | 14.49 | ||
| Turnout | 618,063 | |||
| Republican hold | ||||
Kentucky
[edit]
| |||||||||||||||||
| |||||||||||||||||
 County results Barkley: 50–60% 60–70% 70–80% 80–90% Cooper: 50–60% 60–70% 70–80% 80–90% | |||||||||||||||||
| |||||||||||||||||
| Party | Candidate | Votes | % | |
|---|---|---|---|---|
| Democratic | Alben Barkley | 434,109 | 54.46 | |
| Republican | John Sherman Cooper (Incumbent) | 362,948 | 45.54 | |
| Majority | 71,161 | 8.92 | ||
| Turnout | 797,057 | |||
| Democratic gain from Republican | ||||
Louisiana
[edit]
| |||||||||||||||||
| |||||||||||||||||
 Parish results Ellender: 30–40% 50–60% 60–70% 70–80% 80–90% >90% Ellis: 50-60% | |||||||||||||||||
| |||||||||||||||||
| Party | Candidate | Votes | % | |
|---|---|---|---|---|
| Democratic | Allen J. Ellender (Incumbent) | 207,115 | 100.00 | |
| Democratic hold | ||||
Maine
[edit]
| |||||||||||||||||
| |||||||||||||||||
 County results Smith: 50–60% 60–70% 70–80% Fullam: 50–60% | |||||||||||||||||
| |||||||||||||||||
| Party | Candidate | Votes | % | |
|---|---|---|---|---|
| Republican | Margaret Chase Smith (Incumbent) | 144,530 | 58.61 | |
| Democratic | Paul A. Fullam | 102,075 | 41.39 | |
| Majority | 42,455 | 17.22 | ||
| Turnout | 246,605 | |||
| Republican hold | ||||
Massachusetts
[edit]
| |||||||||||||||||
| |||||||||||||||||
| |||||||||||||||||
| |||||||||||||||||
In Massachusetts, Republican Incumbent Leverett Saltonstall defeated his challengers.
Democrat Foster Furcolo (Treasurer and Receiver-General of Massachusetts since 1952 and member of the United States House of Representatives from Massachusetts's 2nd congressional district from 1949 to 1952) beat John I. Fitzgerald (former member of the Boston City Council and Democratic candidate for Senate in 1948) and Joseph L. Murphy (former member of the Massachusetts Senate).
Republican incumbent Leverett Saltonstall (United States senator since 1945 and Governor of Massachusetts from 1939 to 1945) was renominated. Other nominees included Socialist Workers Thelma Ingersoll (ran for Senate in 1952.[5]) and Prohibition Harold J. Ireland (candidate for Treasurer and Receiver-General in 1948 and 1952).
| Party | Candidate | Votes | % | |
|---|---|---|---|---|
| Democratic | Foster Furcolo | 207,232 | 59.13 | |
| Democratic | Joseph L. Murphy | 79,463 | 22.68 | |
| Democratic | John I. Fitzgerald | 63,752 | 18.19 | |
| Party | Candidate | Votes | % | ±% | |
|---|---|---|---|---|---|
| Republican | Leverett Saltonstall (Incumbent) | 956,605 | 50.54 | −2.41% | |
| Democratic | Foster Furcolo | 927,899 | 49.03 | +2.60% | |
| Socialist Labor | Thelma Ingersoll | 5,353 | 0.28 | −0.17% | |
| Prohibition | Harold J. Ireland | 2,832 | 0.15 | −0.03% | |
| None | Scattering | 21 | 0.00 | ||
| Majority | 28,706 | 1.52 | |||
| Turnout | 1,892,710 | ||||
| Republican hold | Swing | ||||
Michigan
[edit]
| |||||||||||||||||
 County results McNamara: 50–60% 60–70% Ferguson: 50–60% 60–70% 70–80% | |||||||||||||||||
| |||||||||||||||||
| Party | Candidate | Votes | % | |
|---|---|---|---|---|
| Democratic | Patrick V. McNamara | 1,088,550 | 50.75 | |
| Republican | Homer S. Ferguson (Incumbent) | 1,049,420 | 48.93 | |
| Prohibition | Leroy M. Lowell | 4,841 | 0.23 | |
| Socialist Labor | James Sim | 1,126 | 0.05 | |
| Socialist Workers | Rita Shaw | 902 | 0.04 | |
| None | Scattering | 1 | 0.00 | |
| Majority | 39,130 | 1.82 | ||
| Turnout | 2,144,840 | |||
| Democratic gain from Republican | ||||
Minnesota
[edit]
| |||||||||||||||||
 County results Humphrey: 50–60% 60–70% 70–80% Bjornson: 40-50% 50-60% 60-70% | |||||||||||||||||
| |||||||||||||||||
| Party | Candidate | Votes | % | |
|---|---|---|---|---|
| Democratic (DFL) | Hubert Humphrey (Incumbent) | 642,193 | 56.38 | |
| Republican | Val Bjornson | 479,619 | 42.11 | |
| Liberal Independent | Francis Patrick Ryan | 12,457 | 1.09 | |
| Socialist Workers | Vincent R. Dunne | 4,683 | 0.41 | |
| Majority | 162,574 | 14.27 | ||
| Turnout | 1,138,952 | |||
| Democratic (DFL) hold | ||||
Mississippi
[edit]
| |||||||||||||||||
 County results Eastland: 80-90% 90-100% | |||||||||||||||||
| |||||||||||||||||
| Party | Candidate | Votes | % | |
|---|---|---|---|---|
| Democratic | James Eastland (Incumbent) | 100,848 | 95.57 | |
| Republican | James A. White | 4,678 | 4.43 | |
| Majority | 96,070 | 91.14 | ||
| Turnout | 105,526 | |||
| Democratic hold | ||||
Montana
[edit]
| |||||||||||||||||
| |||||||||||||||||
 County results Murray: 50–60% 60–70% D'Ewart: 50–60% 60–70% 70–80% | |||||||||||||||||
| |||||||||||||||||
In Montana incumbent senator James E. Murray, who was first elected to the Senate in a special election in 1934 and was re-elected in 1936, 1942, and 1948, ran for re-election.
Murray won the Democratic primary against trivial opponents (farmer Ray E. Gulick and Sam G. Feezell).
| Party | Candidate | Votes | % | |
|---|---|---|---|---|
| Democratic | James E. Murray (Incumbent) | 65,896 | 86.94 | |
| Democratic | Ray E. Gulick | 4,961 | 6.55 | |
| Democratic | Sam G. Feezell | 4,941 | 6.52 | |
| Total votes | 75,798 | 100.00 | ||
Republican Wesley A. D'Ewart United States Congressman from Montana's 2nd congressional district beat Robert Yellowtail, former Superintendent of the Crow Indian Reservation, for the GOP nomination.
| Party | Candidate | Votes | % | |
|---|---|---|---|---|
| Republican | Wesley A. D'Ewart | 49,964 | 82.36 | |
| Republican | Robert Yellowtail | 10,705 | 17.64 | |
| Total votes | 60,669 | 100.00 | ||
A contentious and close election ensued, but ultimately, Murray was able to narrowly win re-election over D'Ewart to a final term in the Senate.
| Party | Candidate | Votes | % | ±% | |
|---|---|---|---|---|---|
| Democratic | James E. Murray (Incumbent) | 114,591 | 50.38 | −6.27% | |
| Republican | Wesley A. D'Ewart | 112,863 | 49.62 | +6.88% | |
| Majority | 1,728 | 0.76 | −13.15% | ||
| Turnout | 227,454 | ||||
| Democratic hold | Swing | ||||
Nebraska
[edit]Nebraska had three Senate elections on the ballot. Both incumbents had died in the span of three months, leading to appointments and special elections.
Nebraska (special, class 1)
[edit]
| |||||||||||||||||
| |||||||||||||||||
 County results Hruska: 50–60% 60–70% 70–80% Green: 50–60% | |||||||||||||||||
| |||||||||||||||||
Incumbent Republican Hugh A. Butler died July 1, 1954, and governor Robert B. Crosby appointed Republican Samuel W. Reynolds on July 3 to continue the term. Reynolds did not run to finish the term, and Republican Roman Hruska won the seat in November to finish the term ending in 1959.
| Party | Candidate | Votes | % | |
|---|---|---|---|---|
| Republican | Roman Hruska | 250,341 | 60.88 | |
| Democratic | James F. Green | 160,881 | 39.12 | |
| None | Scattering | 3 | 0.00 | |
| Majority | 89,460 | 21.76 | ||
| Turnout | 411,225 | |||
| Republican hold | ||||
Nebraska (special, class 2)
[edit]
| |||||||||||||||||
| |||||||||||||||||
 County results Abel: 50–60% 60–70% 70–80% Meier: 50–60% 60–70% | |||||||||||||||||
| |||||||||||||||||
Second-term Republican Kenneth S. Wherry was re-elected in 1948, but died on November 29, 1951. Governor Val Peterson appointed Fred A. Seaton to fill the seat temporarily. After Seaton chose not to run to continue the term, former governor Dwight P. Griswold elected to fill the remaining two years of the term, but died April 12, 1954, and Republican Eva Bowring was appointed April 16 by governor Crosby to continue Wherry's term. In November, Republican Hazel Abel was elected to finish the term.
| Party | Candidate | Votes | % | |
|---|---|---|---|---|
| Republican | Hazel Abel | 233,589 | 57.76 | |
| Democratic | William H. Meier | 170,828 | 42.24 | |
| None | Scattering | 5 | 0.00 | |
| Majority | 62,761 | 15.52 | ||
| Turnout | 404,422 | |||
| Republican hold | ||||
Nebraska (regular)
[edit]
| |||||||||||||||||
| |||||||||||||||||
 County results Curtis: 50–60% 60–70% 70–80% Neville: 50–60% | |||||||||||||||||
| |||||||||||||||||
Although elected to finish the class 2 term, Abel did not run for the next term, and Republican Carl Curtis was elected in November to the next term.
| Party | Candidate | Votes | % | |
|---|---|---|---|---|
| Republican | Carl T. Curtis | 255,695 | 61.07 | |
| Democratic | Keith Neville | 162,990 | 38.93 | |
| None | Scattering | 6 | 0.00 | |
| Majority | 92,705 | 22.14 | ||
| Turnout | 418,691 | |||
| Republican hold | ||||
On December 31, 1954, Abel resigned and Curtis was appointed January 1, 1955, two days ahead of his elected term.
Nevada (special)
[edit]
| |||||||||||||||||
| |||||||||||||||||
 County results Bible: 50–60% 60–70% 70–80% Brown: 50–60% | |||||||||||||||||
| |||||||||||||||||
| Party | Candidate | Votes | % | |
|---|---|---|---|---|
| Democratic | Alan Bible | 45,043 | 58.11 | |
| Republican | Ernest S. Brown (Incumbent) | 32,470 | 41.89 | |
| Majority | 12,573 | 16.22 | ||
| Turnout | 77,513 | |||
| Democratic gain from Republican | ||||
New Hampshire
[edit]New Hampshire (regular)
[edit]
| |||||||||||||||||
| |||||||||||||||||
 County results Bridges: 50–60% 60–70% 70–80% 80–90% | |||||||||||||||||
| |||||||||||||||||
| Party | Candidate | Votes | % | |
|---|---|---|---|---|
| Republican | Styles Bridges (Incumbent) | 117,150 | 60.22 | |
| Democratic | Gerard L. Morin | 77,386 | 39.78 | |
| Majority | 39,764 | 20.44 | ||
| Turnout | 194,536 | |||
| Republican hold | ||||
New Hampshire (special)
[edit]
| |||||||||||||||||
| |||||||||||||||||
 County results Cotton: 50–60% 60–70% 70–80% 80–90% Betley: 50–60% | |||||||||||||||||
| |||||||||||||||||
| Party | Candidate | Votes | % | |
|---|---|---|---|---|
| Republican | Norris Cotton | 114,068 | 60.18 | |
| Democratic | Stanley J. Betley | 75,490 | 39.82 | |
| Majority | 38,578 | 20.36 | ||
| Turnout | 189,558 | |||
| Republican hold | ||||
New Jersey
[edit]
| |||||||||||||||||
| |||||||||||||||||
 County Results Case: 40–50% 50-60% 60-70% Howell: 40–50% 50–60% 60–70% | |||||||||||||||||
| |||||||||||||||||
| Party | Candidate | Votes | % | |
|---|---|---|---|---|
| Republican | Clifford Case (Incumbent) | 861,528 | 48.66 | |
| Democratic | Charles R. Howell | 858,158 | 48.47 | |
| American Third | Henry Krajewski | 35,421 | 2.00 | |
| Write-In | Fred A. Hartley | 7,025 | 0.40 | |
| Socialist Labor | Albert Ronis | 4,832 | 0.27 | |
| Socialist Workers | George Breitman | 3,590 | 0.20 | |
| Majority | 3,370 | 0.19 | ||
| Turnout | 1,770,554 | |||
| Republican hold | ||||
New Mexico
[edit]
| |||||||||||||||||
| |||||||||||||||||
 County results Anderson: 50–60% 60–70% 70–80% Mechem 50–60% | |||||||||||||||||
| |||||||||||||||||
| Party | Candidate | Votes | % | |
|---|---|---|---|---|
| Democratic | Clinton P. Anderson (Incumbent) | 111,351 | 57.10 | |
| Republican | Edwin L. Mechem | 83,671 | 42.90 | |
| Majority | 27,680 | 14.20 | ||
| Turnout | 195,022 | |||
| Democratic hold | ||||
North Carolina
[edit]Like Nebraska, North Carolina, had three elections on the ballot. Both senators had died during the 83rd Congress, leading to appointments and special elections.
North Carolina (special, class 2)
[edit]Democrat Willis Smith died June 26, 1953, and Democrat Alton A. Lennon was appointed July 10 to continue the term. In November, Lennon lost the nomination to Democrat W. Kerr Scott to finish the term.[8] Scott took office November 29, 1954.
| Party | Candidate | Votes | % | |
|---|---|---|---|---|
| Democratic | W. Kerr Scott | 420,268 | 100.00 | |
| Democratic hold | ||||
North Carolina (regular)
[edit]
| |||||||||||||||||
| |||||||||||||||||
 County results Scott: 50–60% 60–70% 70–80% 80–90% 90-100% West: 50–60% 60–70% 70–80% | |||||||||||||||||
| |||||||||||||||||
Democrat W. Kerr Scott was also elected to the next term, which would begin January 3, 1955.[10]
| Party | Candidate | Votes | % | |
|---|---|---|---|---|
| Democratic | W. Kerr Scott | 408,312 | 65.90 | |
| Republican | Paul C. West | 211,322 | 34.10 | |
| Majority | 196,990 | 31.80 | ||
| Turnout | 619,634 | |||
| Democratic hold | ||||
North Carolina (special, class 3)
[edit]Democrat Clyde R. Hoey died May 12, 1954, and Democrat Sam Ervin was appointed June 5 to continue the term. In November, Ervin was elected to finish the term.
| Party | Candidate | Votes | % | |
|---|---|---|---|---|
| Democratic | Samuel J. Ervin Jr. (Incumbent) | 410,574 | 100.00 | |
| Democratic hold | ||||
Ohio (special)
[edit]
| |||||||||||||||||
| |||||||||||||||||
 County results Bender: 50–60% 60–70% 70–80% Burke: 50–60% 60–70% | |||||||||||||||||
| |||||||||||||||||
| Party | Candidate | Votes | % | |
|---|---|---|---|---|
| Republican | George H. Bender | 1,257,874 | 50.06 | |
| Democratic | Thomas A. Burke (Incumbent) | 1,254,904 | 49.94 | |
| Majority | 2,970 | 0.12 | ||
| Turnout | 2,512,778 | |||
| Republican gain from Democratic | ||||
Oklahoma
[edit]
| |||||||||||||||||
| |||||||||||||||||
 County results Kerr: 50–60% 60–70% 70–80% 80–90% Mock: 50–60% 60–70% | |||||||||||||||||
| |||||||||||||||||
| Party | Candidate | Votes | % | |
|---|---|---|---|---|
| Democratic | Robert S. Kerr (Incumbent) | 335,127 | 55.84 | |
| Republican | Fred M. Mock | 262,013 | 43.66 | |
| Independent | George V. Fried | 1,563 | 0.26 | |
| Independent | George H. Brasier | 1,417 | 0.24 | |
| Majority | 73,114 | 12.18 | ||
| Turnout | 600,120 | |||
| Democratic hold | ||||
Oregon
[edit]
| |||||||||||||||||
| |||||||||||||||||
 County results Neuberger: 50–60% 60–70% Cordon: 50-60% 60-70% | |||||||||||||||||
| |||||||||||||||||
| Party | Candidate | Votes | % | |
|---|---|---|---|---|
| Democratic | Richard L. Neuberger | 285,775 | 50.22 | |
| Republican | Guy Cordon (Incumbent) | 283,313 | 49.78 | |
| Majority | 2,462 | 0.44 | ||
| Turnout | 569,088 | |||
| Democratic gain from Republican | ||||
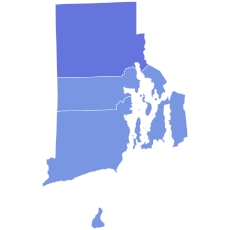
Rhode Island
[edit]
| |||||||||||||||||
| |||||||||||||||||
Green: 50–60% 60–70% Sundlun: 50–60% 60–70% | |||||||||||||||||
| |||||||||||||||||
| Party | Candidate | Votes | % | |
|---|---|---|---|---|
| Democratic | Theodore Francis Green (Incumbent) | 193,654 | 59.29 | |
| Republican | Walter I. Sundlun | 132,970 | 40.71 | |
| Majority | 60,684 | 18.58 | ||
| Turnout | 326,624 | |||


 French
 Deutsch
