
 French
 Deutsch
1992 United States Senate elections
| ||||||||||||||||||||||||||||||||||||||||
36 of the 100 seats in the United States Senate 51 seats needed for a majority | ||||||||||||||||||||||||||||||||||||||||
|---|---|---|---|---|---|---|---|---|---|---|---|---|---|---|---|---|---|---|---|---|---|---|---|---|---|---|---|---|---|---|---|---|---|---|---|---|---|---|---|---|
| ||||||||||||||||||||||||||||||||||||||||
 | ||||||||||||||||||||||||||||||||||||||||
.jpg)
.JPG)
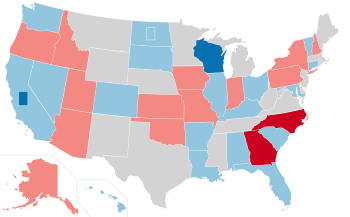
The 1992 United States Senate elections, held November 3, 1992, were elections for the United States Senate. The 34 seats of Class 3 were contested in regular elections, along with special elections to fill vacancies. They coincided with Bill Clinton's victory in the presidential election. This was the first time since 1956 that the balance of the Senate remained the same.
Both parties swapped a pair of seats, resulting in no net change in the partisan breakdown, which had been at 57–43 since Democrats flipped a seat in Pennsylvania in a special election. Democratic victories over Republicans John F. Seymour in the special California race and Bob Kasten in Wisconsin were canceled out by the defeats of Democrats Wyche Fowler in Georgia and Terry Sanford in North Carolina.
The election of 4 new Democratic women to the Senate was notable with it being referred to in the press as the "Year of the Woman". Due to a special election in California, both of California's Senate seats were up for election in 1992, and these seats were won by Dianne Feinstein and Barbara Boxer. Thus, California became the first state to have elected women to occupy both of its Senate seats. Democrat Carol Moseley Braun of Illinois, became the first African-American woman in the United States Senate. As of 2023[update], this was the last election cycle in which Republicans won a Senate election in New York and Democrats in Kentucky.
Results summary
[edit]| 57 | 43 |
| Democratic | Republican |
Seat totals include both the special elections in California and North Dakota, but vote totals exclude the North Dakota total.
| Parties | Total | ||||||||||||||||||||||||||||||||||||||||||||||||||||||||||||||||||||||||||||||||||||||||||||||||||
|---|---|---|---|---|---|---|---|---|---|---|---|---|---|---|---|---|---|---|---|---|---|---|---|---|---|---|---|---|---|---|---|---|---|---|---|---|---|---|---|---|---|---|---|---|---|---|---|---|---|---|---|---|---|---|---|---|---|---|---|---|---|---|---|---|---|---|---|---|---|---|---|---|---|---|---|---|---|---|---|---|---|---|---|---|---|---|---|---|---|---|---|---|---|---|---|---|---|---|---|
| Democratic | Republican | Libertarian | Independent | Other | |||||||||||||||||||||||||||||||||||||||||||||||||||||||||||||||||||||||||||||||||||||||||||||||
| Last elections (1990) | 56 | 44 | 0 | 0 | 0 | 100 | |||||||||||||||||||||||||||||||||||||||||||||||||||||||||||||||||||||||||||||||||||||||||||||
| Before these elections | 57 | 43 | 0 | 0 | 0 | 100 | |||||||||||||||||||||||||||||||||||||||||||||||||||||||||||||||||||||||||||||||||||||||||||||
| Not up | 36 | 28 | — | — | — | 64 | |||||||||||||||||||||||||||||||||||||||||||||||||||||||||||||||||||||||||||||||||||||||||||||
| Up | 21 | 15 | — | — | — | 36 | |||||||||||||||||||||||||||||||||||||||||||||||||||||||||||||||||||||||||||||||||||||||||||||
| Class 3 (1986→1992) | 20 | 14 | — | — | — | 34 | |||||||||||||||||||||||||||||||||||||||||||||||||||||||||||||||||||||||||||||||||||||||||||||
| Special: Class 1 | 1 | 1 | — | — | — | 2 | |||||||||||||||||||||||||||||||||||||||||||||||||||||||||||||||||||||||||||||||||||||||||||||
| Incumbent retired | 5[b] | 3 | — | — | — | 8 | |||||||||||||||||||||||||||||||||||||||||||||||||||||||||||||||||||||||||||||||||||||||||||||
| Held by same party | 5 | 3 | — | — | — | 8 | |||||||||||||||||||||||||||||||||||||||||||||||||||||||||||||||||||||||||||||||||||||||||||||
| Replaced by other party | 0 | 0 | — | — | — | 0 | |||||||||||||||||||||||||||||||||||||||||||||||||||||||||||||||||||||||||||||||||||||||||||||
| Result | 5 | 3 | — | — | — | 8 | |||||||||||||||||||||||||||||||||||||||||||||||||||||||||||||||||||||||||||||||||||||||||||||
| Incumbent ran | 16[c] | 12[d] | — | — | — | 28 | |||||||||||||||||||||||||||||||||||||||||||||||||||||||||||||||||||||||||||||||||||||||||||||
| Won re-election | 13 | 10 | — | — | — | 23 | |||||||||||||||||||||||||||||||||||||||||||||||||||||||||||||||||||||||||||||||||||||||||||||
| Lost re-election | — | — | — | 4 | |||||||||||||||||||||||||||||||||||||||||||||||||||||||||||||||||||||||||||||||||||||||||||||||
| Lost renomination, but held by same party | 1 | 0 | — | — | — | 1 | |||||||||||||||||||||||||||||||||||||||||||||||||||||||||||||||||||||||||||||||||||||||||||||
| Result | 16 | 12 | — | — | — | 28 | |||||||||||||||||||||||||||||||||||||||||||||||||||||||||||||||||||||||||||||||||||||||||||||
| Total elected | 21 | 15 | — | — | — | 36 | |||||||||||||||||||||||||||||||||||||||||||||||||||||||||||||||||||||||||||||||||||||||||||||
| Net gain/loss | 0 | ||||||||||||||||||||||||||||||||||||||||||||||||||||||||||||||||||||||||||||||||||||||||||||||||||
| Nationwide vote | 40,589,727 | 35,449,473 | 1,234,416 | 624,673 | 3,486,729 | 81,385,018 | |||||||||||||||||||||||||||||||||||||||||||||||||||||||||||||||||||||||||||||||||||||||||||||
| Share | 49.87% | 43.56% | 1.52% | 0.77% | 4.28% | 100% | |||||||||||||||||||||||||||||||||||||||||||||||||||||||||||||||||||||||||||||||||||||||||||||
| Result | 57 | 43 | — | — | — | 100 | |||||||||||||||||||||||||||||||||||||||||||||||||||||||||||||||||||||||||||||||||||||||||||||
Source: Office of the Clerk of the U.S. House of Representatives[1]
Gains and losses
[edit]Retirements
[edit]Three Republicans and four Democrats retired instead of seeking re-election. One Democrat also retired instead of finishing the unexpired term.
Defeats
[edit]One Republican and three Democrats sought re-election but lost either in the primary or general election. One Republican also sought election to finish the term but lost in the special election.
Post-election changes
[edit]Two Democrats resigned and were replaced by appointees. In Texas, a 1993 special election was held prior to the 1994 United States Senate elections, where Kay Bailey Hutchison won the special election to succeed Democratic appointee Bob Krueger, who lost election to finish the term.
| State | Senator | Replaced by |
|---|---|---|
| Tennessee (Class 2) | Al Gore | Harlan Mathews |
| Texas (Class 1) | Lloyd Bentsen | Bob Krueger |
| Texas (Class 1) | Bob Krueger | Kay Bailey Hutchison |
Change in composition
[edit]Before the elections
[edit]| D1 | D2 | D3 | D4 | D5 | D6 | D7 | D8 | D9 | D10 |
| D20 | D19 | D18 | D17 | D16 | D15 | D14 | D13 | D12 | D11 |
| D21 | D22 | D23 | D24 | D25 | D26 | D27 | D28 | D29 | D30 |
| D40 Colo. Retired | D39 Calif. (reg) Retired | D38 Ark. Ran | D37 Ala. Ran | D36 | D35 | D34 | D33 | D32 | D31 |
| D41 Conn. Ran | D42 Fla. Ran | D43 Ga. Ran | D44 Hawaii Ran | D45 Ill. Ran | D46 Ky. Ran | D47 La. Ran | D48 Md. Ran | D49 Nev. Ran | D50 N.C. Ran |
| Majority → | D51 N.D. (reg) Retired | ||||||||
| R41 Pa. Ran | R42 Utah Retired | R43 Wisc. Ran | D57 Wash. Retired | D56 Vt. Ran | D55 S.D. Ran | D54 S.C. Ran | D53 Ohio Ran | D52 N.D. (sp) Retired | |
| R31 Calif. (sp) Ran | R32 Idaho Retired | R33 Ind. Ran | R34 Iowa Ran | R35 Kan. Ran | R36 Mo. Ran | R37 N.H. Retired | R38 N.Y. Ran | R39 Okla. Ran | R40 Ore. Ran |
| R21 | R22 | R23 | R24 | R25 | R26 | R27 | R28 | R29 Ariz. Ran | R30 Alaska Ran |
| R20 | R19 | R18 | R17 | R16 | R15 | R14 | R13 | R12 | R11 |
| R1 | R2 | R3 | R4 | R5 | R6 | R7 | R8 | R9 | R10 |
Result of the elections
[edit]| D1 | D2 | D3 | D4 | D5 | D6 | D7 | D8 | D9 | D10 |
| D20 | D19 | D18 | D17 | D16 | D15 | D14 | D13 | D12 | D11 |
| D21 | D22 | D23 | D24 | D25 | D26 | D27 | D28 | D29 | D30 |
| D40 Colo. Hold | D39 Calif. (reg) Hold | D38 Ark. Re-elected | D37 Ala. Re-elected | D36 | D35 | D34 | D33 | D32 | D31 |
| D41 Conn. Re-elected | D42 Fla. Re-elected | D43 Hawaii Re-elected | D44 Ill. Hold | D45 Ky. Re-elected | D46 La. Re-elected | D47 Md. Re-elected | D48 Nev. Re-elected | D49 N.D. (reg) Hold | D50 N.D. (sp) Hold |
| Majority → | D51 Ohio Re-elected | ||||||||
| R41 Utah Hold | R42 Ga. Gain | R43 N.C. Gain | D57 Wisc. Gain | D56 Calif. (sp) Gain[e] | D55 Wash. Hold | D54 Vt. Re-elected | D53 S.D. Re-elected | D52 S.C. Re-elected | |
| R40 Pa. Re-elected | R39 Ore. Re-elected | R38 Okla. Re-elected | R37 N.Y. Re-elected | R36 N.H. Hold | R35 Mo. Re-elected | R34 Kan. Re-elected | R33 Iowa Re-elected | R32 Ind. Re-elected | R31 Idaho Hold |
| R21 | R22 | R23 | R24 | R25 | R26 | R27 | R28 | R29 Alaska Re-elected | R30 Ariz. Re-elected |
| R20 | R19 | R18 | R17 | R16 | R15 | R14 | R13 | R12 | R11 |
| R1 | R2 | R3 | R4 | R5 | R6 | R7 | R8 | R9 | R10 |
Beginning of the first session
[edit]| D1 | D2 | D3 | D4 | D5 | D6 | D7 | D8 | D9 | D10 |
| D20 | D19 | D18 | D17 | D16 | D15 | D14 | D13 | D12 | D11 |
| D21 | D22 | D23 | D24 | D25 | D26 | D27 | D28 | D29 | D30 |
| D40 | D39 | D38 | D37 | D36 | D35 | D34 | D33 | D32 | D31 |
| D41 | D42 | D43 | D44 | D45 | D46 | D47 | D48 | D49 | D50 |
| Majority → | D51 | ||||||||
| R41 | R42 | R43 | R44 Texas Gain | D56 | D55 | D54 | D53 | D52 | |
| R40 | R39 | R38 | R37 | R36 | R35 | R34 | R33 | R32 | R31 |
| R21 | R22 | R23 | R24 | R25 | R26 | R27 | R28 | R29 | R30 |
| R20 | R19 | R18 | R17 | R16 | R15 | R14 | R13 | R12 | R11 |
| R1 | R2 | R3 | R4 | R5 | R6 | R7 | R8 | R9 | R10 |
| Key |
|
|---|
Race summary
[edit]Special elections
[edit]In these special elections, the winners were elected and seated in the fall of 1992. Elections are sorted by election date then state and class.
| State (linked to summaries below) | Incumbent | Results | Candidates | ||
|---|---|---|---|---|---|
| Senator | Party | Electoral history | |||
| California (Class 1) | John Seymour | Republican | 1991 (Appointed) | Interim appointee lost election. New senator elected November 3, 1992. Democratic gain. Successor seated November 4, 1992. |
|
| North Dakota (Class 1) | Jocelyn Burdick | Democratic-NPL | 1992 (Appointed) | Interim appointee retired. New senator elected December 4, 1992. Democratic-NPL hold. Successor seated December 14, 1992. |
|
Elections leading to the next Congress
[edit]In these general elections, the winners were elected for the term beginning January 3, 1993; ordered by state.
All of the elections involved the Class 3 seats.
| State (linked to summaries below) | Incumbent | Results | Candidates | ||
|---|---|---|---|---|---|
| Senator | Party | Electoral history | |||
| Alabama | Richard Shelby | Democratic | 1986 | Incumbent re-elected. |
|
| Alaska | Frank Murkowski | Republican | 1980 1986 | Incumbent re-elected. |
|
| Arizona | John McCain | Republican | 1986 | Incumbent re-elected. |
|
| Arkansas | Dale Bumpers | Democratic | 1974 1980 1986 | Incumbent re-elected. |
|
| California | Alan Cranston | Democratic | 1968 1974 1980 1986 | Incumbent retired. New senator elected. Democratic hold. |
|
| Colorado | Tim Wirth | Democratic | 1986 | Incumbent retired. New senator elected. Democratic hold. |
|
| Connecticut | Chris Dodd | Democratic | 1980 1986 | Incumbent re-elected. |
|
| Florida | Bob Graham | Democratic | 1980 1986 | Incumbent re-elected. |
|
| Georgia | Wyche Fowler | Democratic | 1986 | Incumbent lost re-election. New senator elected. Republican gain. |
|
| Hawaii | Daniel Inouye | Democratic | 1962 1968 1974 1980 1986 | Incumbent re-elected. |
|
| Idaho | Steve Symms | Republican | 1980 1986 | Incumbent retired. New senator elected. Republican hold. |
|
| Illinois | Alan J. Dixon | Democratic | 1980 1986 | Incumbent lost renomination. New senator elected. Democratic hold. |
Others
|
| Indiana | Dan Coats | Republican | 1989 (Appointed) 1990 (special) | Incumbent re-elected. |
|
| Iowa | Chuck Grassley | Republican | 1980 1986 | Incumbent re-elected. |
Others
|
| Kansas | Bob Dole | Republican | 1968 1974 1980 1986 | Incumbent re-elected. |
|
| Kentucky | Wendell Ford | Democratic | 1974 1980 1986 | Incumbent re-elected. |
|
| Louisiana | John Breaux | Democratic | 1986 | Incumbent re-elected. |
|
| Maryland | Barbara Mikulski | Democratic | 1986 | Incumbent re-elected. |
|
| Missouri | Kit Bond | Republican | 1986 | Incumbent re-elected. |
|
| Nevada | Harry Reid | Democratic | 1986 | Incumbent re-elected. |
|
| New Hampshire | Warren Rudman | Republican | 1980 1986 | Incumbent retired. New senator elected. Republican hold. |
|
| New York | Al D'Amato | Republican | 1980 1986 | Incumbent re-elected. |
Others
|
| North Carolina | Terry Sanford | Democratic | 1986 (special) 1986 | Incumbent lost re-election. New senator elected. Republican gain. |
|
| North Dakota | Kent Conrad | Democratic-NPL | 1986 | Incumbent retired. New senator elected. Democratic-NPL hold. Incumbent resigned December 14, 1992 to move to the other seat. Winner appointed December 15, 1992. |
|
| Ohio | John Glenn | Democratic | 1974 1974 (Appointed) 1980 1986 | Incumbent re-elected. |
|
| Oklahoma | Don Nickles | Republican | 1980 1986 | Incumbent re-elected. |
|
| Oregon | Bob Packwood | Republican | 1968 1974 1980 1986 | Incumbent re-elected. |
|
| Pennsylvania | Arlen Specter | Republican | 1980 1986 | Incumbent re-elected. |
|
| South Carolina | Fritz Hollings | Democratic | 1966 (special) 1968 1974 1980 1986 | Incumbent re-elected. |
|
| South Dakota | Tom Daschle | Democratic | 1986 | Incumbent re-elected. |
|
| Utah | Jake Garn | Republican | 1974 1980 1986 | Incumbent retired. New senator elected. Republican hold. |
|
| Vermont | Patrick Leahy | Democratic | 1974 1980 1986 | Incumbent re-elected. |
|
| Washington | Brock Adams | Democratic | 1986 | Incumbent retired. New senator elected. Democratic hold. |
|
| Wisconsin | Bob Kasten | Republican | 1980 1986 | Incumbent lost re-election. New senator elected. Democratic gain. |
Others
|
Closest races
[edit]In thirteen races, the margin of victory was under 10%.
| State | Party of winner | Margin |
|---|---|---|
| New York | Republican | 1.25% |
| Georgia | Republican (flip) | 1.30% |
| Pennsylvania | Republican | 2.77% |
| New Hampshire | Republican | 2.82% |
| South Carolina | Democratic | 3.12% |
| North Carolina | Republican (flip) | 4.03% |
| California (regular) | Democratic | 4.90% |
| Oregon | Republican | 5.64% |
| Wisconsin | Democratic (flip) | 6.56% |
| Missouri | Republican | 6.96% |
| Washington | Democratic | 7.98% |
| Ohio | Democratic | 8.66% |
| Colorado | Democratic | 9.07% |
Illinois was the tipping point state, decided by a margin of 10%.
Alabama
[edit]
| |||||||||||||||||
 County results Shelby: 50–60% 60–70% 70–80% 80–90% 90–100% Sellers: 50–60% | |||||||||||||||||
| |||||||||||||||||


Incumbent Democrat Richard Shelby won re-election to a second term, beating Richard Sellers, a conservative activist.[2]
| Party | Candidate | Votes | % | |
|---|---|---|---|---|
| Democratic | Richard Shelby (incumbent) | 1,022,698 | 64.8% | |
| Republican | Richard Sellers | 522,015 | 33.1% | |
| Libertarian | Jerome Shockley | 31,811 | 2.0% | |
| Independent | Write Ins | 1,275 | 0.1% | |
| Majority | 500,683 | 31.7% | ||
| Turnout | 1,577,799 | |||
| Democratic hold | ||||
Alaska
[edit]
| |||||||||||||||||||||||||||||||||||||
 Results by state house district Murkowski: 40–50% 50–60% Smith: 40–50% 50–60% | |||||||||||||||||||||||||||||||||||||
| |||||||||||||||||||||||||||||||||||||


Incumbent Republican Frank Murkowski sought re-election to a third term in the United States Senate. Tony Smith, the Democratic nominee and a former Commissioner of Economic Development, won his party's nomination in a crowded primary and faced off against Murkowski in the general election. Though Murkowski was held to a lower vote percentage than he received six years prior, he was ultimately re-elected.
| Party | Candidate | Votes | % | |
|---|---|---|---|---|
| Democratic | Tony Smith | 33,162 | 44.81% | |
| Democratic | William L. Hensley | 29,586 | 39.98% | |
| Green | Mary Jordan | 5,989 | 8.09% | |
| Democratic | Michael Beasley | 2,657 | 3.59% | |
| Democratic | Joseph Sonneman | 1,607 | 2.17% | |
| Democratic | Frank Vondersaar | 1,000 | 1.35% | |
| Total votes | 74,001 | 100.00% | ||
| Party | Candidate | Votes | % | |
|---|---|---|---|---|
| Republican | Frank Murkowski (Incumbent) | 37,486 | 80.53% | |
| Republican | Jed Whittaker | 9,065 | 19.47% | |
| Total votes | 46,551 | 100.00% | ||
| Party | Candidate | Votes | % | ±% | |
|---|---|---|---|---|---|
| Republican | Frank Murkowski (Incumbent) | 127,163 | 53.05% | −0.98% | |
| Democratic | Tony Smith | 92,065 | 38.41% | −5.69% | |
| Green | Mary Jordan | 20,019 | 8.35% | ||
| Write-ins | 467 | 0.19% | |||
| Majority | 35,098 | 14.64% | +4.72% | ||
| Turnout | 239,714 | ||||
| Republican hold | Swing | ||||
Arizona
[edit]
| |||||||||||||||||||||||||||||||||||||
 County results McCain: 40–50% 50–60% Sargent: 40–50% | |||||||||||||||||||||||||||||||||||||
| |||||||||||||||||||||||||||||||||||||

_(1).jpg)
Incumbent Republican John McCain won re-election to a second term over Democrat Claire Sargent, community activist[6] and Independent former Governor Evan Mecham.
| Party | Candidate | Votes | % | ±% | |
|---|---|---|---|---|---|
| Republican | John McCain (Incumbent) | 771,395 | 55.82% | −4.66% | |
| Democratic | Claire Sargent | 436,321 | 31.57% | −7.94% | |
| Independent | Evan Mecham | 145,361 | 10.52% | ||
| Libertarian | Kiana Delamare | 22,613 | 1.64% | ||
| New Alliance | Ed Finkelstein | 6,335 | 0.46% | ||
| Write-ins | 26 | 0.00% | |||
| Majority | 335,074 | 24.24% | +3.28% | ||
| Turnout | 1,382,051 | ||||
| Republican hold | Swing | ||||
Arkansas
[edit]
| |||||||||||||||||
 County results Bumpers: 50–60% 60–70% 70–80% 80–90% | |||||||||||||||||
| |||||||||||||||||

.jpg)
Incumbent Democratic senator Dale Bumpers won re-election to a fourth term. His Republican opponent was future Arkansas lieutenant governor, governor, and two-time presidential candidate Mike Huckabee, a church pastor from Texarkana.
The 1992 election coincided with Arkansas governor Bill Clinton's election as President of the United States, in which he also won his home state. In contrast with Bumpers' landslide where he won over 60% of the vote, Clinton won only 53.21% of the vote. Bumpers would serve another term in the U.S. Senate before deciding to retire in 1998.
| Party | Candidate | Votes | % | |
|---|---|---|---|---|
| Democratic | Dale Bumpers (Incumbent) | 553,635 | 60.2% | |
| Republican | Mike Huckabee | 366,373 | 39.8% | |
| Majority | 187,262 | 20.4% | ||
| Turnout | 920,008 | |||
| Democratic hold | ||||
California
[edit]Due to the resignation of Pete Wilson to become Governor of California, there were two senate elections in California as both seats were up for election and both won by women. California ultimately become the first state to have two sitting women senators.
California (regular)
[edit]
| |||||||||||||||||
 County results Boxer: 40–50% 50–60% 60–70% Herchensohn: 40–50% 50–60% 60–70% | |||||||||||||||||
| |||||||||||||||||


Incumbent Democrat Alan Cranston decided to retire. Democratic U.S. Congresswoman Barbara Boxer won the open seat over Republican conservative TV talk show commentator Bruce Herschensohn. Both of California's senators were elected for the first time. This is not a unique occurrence; it would happen again in Tennessee in 1994, Kansas in 1996 and Georgia in 2020-2021. Fellow Democrat Dianne Feinstein, California's other senator, won the special election and was inaugurated in November 1992.
The election between Boxer and Herschensohn was very close. At the eleventh hour, controversy emerged that the Republican nominee attended a strip club, which some Republican operatives later blamed for Herschensohn's loss.[8]
Four days before Election Day polls showed Herschensohn had narrowed a double digit deficit, trailing by 3 points. Political operative Bob Mulholland disrupted a campaign appearance with a large poster advertising a strip club shouting "Should the voters of California elect someone who frequently travels the strip joints of Hollywood?" Herschensohn admitted he had visited a strip club once, with his girlfriend and another couple. With press coverage of the story, Herschensohn spent the waning days of the campaign denying related allegations. When the votes were cast and counted, Barbara Boxer won the election by five points.[9] Although Republicans have blamed the defeat on the underhanded tactics of the Boxer campaign, evidence of the connection between Mulholland's outburst and the campaign never surfaced.[10][11][12]
The election was very close. Boxer was declared the winner by the Associated Press at 1:22 A.M. Pacific Coast Time.
| Party | Candidate | Votes | % | |
|---|---|---|---|---|
| Democratic | Barbara Boxer | 5,173,467 | 47.90 | |
| Republican | Bruce Herschensohn | 4,644,182 | 43.00 | |
| American Independent | Jerome N. McCready | 373,051 | 3.45 | |
| Peace and Freedom | Genevieve Torres | 372,817 | 3.45 | |
| Libertarian | June R. Genis | 235,919 | 2.18 | |
| No party | Write-ins | 267 | 0.00 | |
| Invalid or blank votes | 574,862 | 5.05 | ||
| Total votes | 11,374,565 | 100.00 | ||
| Turnout | 54.52 | |||
| Democratic hold | ||||
California (special)
[edit]
| |||||||||||||||||
 County results Feinstein: 40–50% 50–60% 60–70% 70–80% Seymour: 40–50% 50–60% | |||||||||||||||||
| |||||||||||||||||


In the 1990 gubernatorial election, Republican senator Pete Wilson had beaten Democrat Dianne Feinstein for governor. He appointed John F. Seymour to the Senate to replace himself. In this special election held simultaneously with the regular Senate election, Feinstein defeated Seymour to serve the remaining 2 years of the term and took office November 4, only 1 day after the election. Fellow Democrat Barbara Boxer won the regular election and was sworn in in January 1993.
Both of California's senators were elected for the first time. This is not a unique occurrence; it would happen again in Tennessee in 1994, Kansas in 1996, and Georgia in 2020.
| Party | Candidate | Votes | % | |||
|---|---|---|---|---|---|---|
| Democratic | Dianne Feinstein | 5,853,651 | 54.29% | |||
| Republican | John F. Seymour (Incumbent) | 4,093,501 | 37.96% | |||
| Peace and Freedom | Gerald Horne | 305,697 | 2.84% | |||
| American Independent | Paul Meeuwenberg | 281,973 | 2.62% | |||
| Libertarian | Richard Benjamin Boddie | 247,799 | 2.30% | |||
| No party | Write-ins | 122 | 0.00% | |||
| Invalid or blank votes | 591,822 | 5.20% | ||||
| Total votes | 11,374,565 | 100.00% | ||||
| Turnout | 54.52 | |||||
| Democratic gain from Republican | ||||||
Colorado
[edit]
| |||||||||||||||||
 County results Nighthorse Campbell: 40–50% 50–60% 60–70% 70–80% Considine: 40–50% 50–60% 60–70% | |||||||||||||||||
| |||||||||||||||||

Incumbent Democrat Tim Wirth decided to retire instead of seeking a second term. Democratic congressman Ben Nighthorse Campbell won the open seat, beating Republican State senator Terry Considine.
| Party | Candidate | Votes | % | |
|---|---|---|---|---|
| Democratic | Ben Nighthorse Campbell | 117,634 | 45.48% | |
| Democratic | Dick Lamm | 93,599 | 36.19% | |
| Democratic | Josie Heath | 47,418 | 18.33% | |
| Total votes | 258,651 | 100.00% | ||
| Party | Candidate | Votes | % | ±% | |
|---|---|---|---|---|---|
| Democratic | Ben Nighthorse Campbell | 803,725 | 51.78% | +1.86% | |
| Republican | Terry Considine | 662,893 | 42.70% | −5.66% | |
| Independent | Richard O. Grimes | 42,455 | 2.73% | ||
| Pro-Life | Matt Noah | 22,846 | 1.47% | ||
| Independent | Dan Winters | 20,347 | 1.31% | ||
| Libertarian | Hue Futch | 23 | 0.00% | ||
| Majority | 140,832 | 9.07% | +7.52% | ||
| Turnout | 1,552,289 | ||||
| Democratic hold | Swing | ||||
Connecticut
[edit]
| |||||||||||||||||
  Dodd: 40–50% 50–60% 60–70% 70–80% 80–90% Johnson: 40–50% 50–60% 60–70% | |||||||||||||||||
| |||||||||||||||||

Incumbent Democrat Christopher Dodd won re-election for a third term over Republican businessman Brook Johnson.
Johnson, a millionaire businessman who had never run for public office before, spent about $900,000 during the primary campaign. His television and radio commercials said that he would bring "a dose of success Washington needs." Dodd had $2 million cash on hand following the primaries.[14]
| Party | Candidate | Votes | % | ||
|---|---|---|---|---|---|
| Democratic | Christopher Dodd (Incumbent) | 882,569 | 58.81% | ||
| Republican | Brook Johnson | 572,036 | 38.12% | ||
| Concerned Citizens | Richard D. Gregory | 35,315 | 2.35% | ||
| Libertarian | Howard A. Grayson Jr. | 10,741 | 0.72% | ||
| Total votes | 1,500,661 | 100.00% | |||
| Democratic hold | |||||
Florida
[edit]
| |||||||||||||||||
 Graham: 50–60% 60–70% 70–80% 80–90% Grant: 50–60% | |||||||||||||||||
| |||||||||||||||||

.jpg)
Incumbent Democrat Bob Graham won re-election to a second term, beating Republican former U.S. Representative Bill Grant.
| Party | Candidate | Votes | % | |
|---|---|---|---|---|
| Democratic | Bob Graham (Incumbent) | 968,618 | 84.3% | |
| Democratic | Jim Mahorner | 180,405 | 15.7% | |
| Total votes | 1,149,023 | 100.0% | ||
| Party | Candidate | Votes | % | |
|---|---|---|---|---|
| Republican | Bill Grant | 413,457 | 56.1% | |
| Republican | Rob Quartel | 196,524 | 26.7% | |
| Republican | Hugh Brotherton | 126,878 | 17.2% | |
| Total votes | 736,859 | 100.0% | ||
Graham defeated Grant in a landslide, as Grant won just one county in the state (Okaloosa County, Florida). There were no third party or independent candidates.
| Party | Candidate | Votes | % | ±% | |
|---|---|---|---|---|---|
| Democratic | Bob Graham (incumbent) | 3,245,565 | 65.40% | +10.66% | |
| Republican | Bill Grant | 1,716,505 | 34.59% | −10.67% | |
| Write-ins | Marie Davis | 220 | 0.01% | ||
| Majority | 1,529,060 | 30.81% | |||
| Total votes | 4,962,290 | 100.00% | |||
| Democratic hold | Swing | ||||
Georgia
[edit]
| |||||||||||||||||
| |||||||||||||||||
  Coverdell: 40–50% 50–60% 60–70% 70–80% Fowler: 40–50% 50–60% 60–70% 70–80% 80–90% | |||||||||||||||||
| |||||||||||||||||
.PNG)
_(cropped).jpg)
Incumbent Democrat Wyche Fowler did not receive a simple majority in the general election, which demanded a runoff. Paul Coverdell, former Director of the Peace Corps and former State senator, edged out Fowler in the runoff with a narrow margin.[5]
The general primary was held July 21, 1992.[18] A run-off between the top two Republican contenders was held on August 11, in which Paul Coverdell defeated Bob Barr.
Results[19] for the first round showed that since Paul Coverdell did not win a majority of the vote, a runoff was held between him and Barr. Coverdell subsequently won the runoff.
| Party | Candidate | Votes | % | |
|---|---|---|---|---|
| Republican | Paul Coverdell | 100,016 | 37.05% | |
| Republican | Bob Barr | 65,471 | 24.25% | |
| Republican | John Knox | 64,514 | 23.90% | |
| Republican | Charlie Tanksley | 32,590 | 12.07% | |
| Republican | Dean Parkison | 7,352 | 2.72% | |
| Turnout | 269,943 | 100.00% | ||
| Party | Candidate | Votes | % | |
|---|---|---|---|---|
| Republican | Paul Coverdell | 80,435 | 50.49% | |
| Republican | Bob Barr | 78,887 | 49.51% | |
| Turnout | 159,332 | 100.00% | ||
| Party | Candidate | Votes | % | |
|---|---|---|---|---|
| Democratic | Wyche Fowler (Incumbent) | 1,108,416 | 49.23% | |
| Republican | Paul Coverdell | 1,073,282 | 47.67% | |
| Libertarian | Jim Hudson | 69,878 | 3.10% | |
| Write-In Votes | 11 | 0.00% | ||
| Majority | 35,134 | 1.56% | ||
| Turnout | 2,251,587 | |||
As no candidate reached a majority on November 3, a runoff election was held on November 24, which Coverdell won.
| Party | Candidate | Votes | % | |
|---|---|---|---|---|
| Republican | Paul Coverdell | 635,118 | 50.65% | |
| Democratic | Wyche Fowler (Incumbent) | 618,774 | 49.35% | |
| Majority | 16,344 | 1.30% | ||
| Turnout | 1,253,892 | |||
| Republican gain from Democratic | ||||
Hawaii
[edit]
| |||||||||||||||||||||||||||||||||||||
 County results Inouye: 50–60% 60–70% | |||||||||||||||||||||||||||||||||||||
| |||||||||||||||||||||||||||||||||||||

Incumbent Democrat Daniel Inouye won re-election to a sixth term over Republican State senator Rick Reed.[20]
| Party | Candidate | Votes | % | |
|---|---|---|---|---|
| Democratic | Daniel Inouye (Incumbent) | 208,266 | 57.3% | |
| Republican | Rick Reed | 97,928 | 26.9% | |
| Green | Linda Martin | 49,921 | 13.7% | |
| Libertarian | Richard O. Rowland | 7,547 | 2.1% | |
| Total votes | 363,662 | 100.0% | ||
| Majority | 110,338 | 30.4% | ||
| Democratic hold | ||||
Idaho
[edit]
| |||||||||||||||||
 County results Kempthorne: 50–60% 60–70% Stallings: 50–60% 60–70% | |||||||||||||||||
| |||||||||||||||||


Incumbent Republican Steve Symms decided to retire instead of seeking a third term. Republican Mayor of Boise Dirk Kempthorne won the open seat, beating Democratic congressman Richard H. Stallings.
| Party | Candidate | Votes | % | |
|---|---|---|---|---|
| Democratic | Richard H. Stallings | 40,102 | 71.66 | |
| Democratic | Matt Schaffer | 8,976 | 16.04 | |
| Democratic | David W. Sheperd | 6,882 | 12.30 | |
| Total votes | 55,960 | 100.00 | ||
| Party | Candidate | Votes | % | |
|---|---|---|---|---|
| Republican | Dirk Kempthorne | 67,001 | 57.43 | |
| Republican | Rod Beck | 26,977 | 23.12 | |
| Republican | Milt Erhart | 22,682 | 19.44 | |
| Total votes | 116,660 | 100.00 | ||
| Party | Candidate | Votes | % | ±% | |
|---|---|---|---|---|---|
| Republican | Dirk Kempthorne | 270,468 | 56.52 | +4.97 | |
| Democratic | Richard H. Stallings | 208,036 | 43.48 | −4.97 | |
| Majority | 62,432 | 13.05 | +9.93 | ||
| Turnout | 478,504 | ||||
| Republican hold | Swing | ||||
Illinois
[edit]
| |||||||||||||||||
 County Results Braun: 40–50% 50–60% 60–70% Williamson: 40–50% 50–60% | |||||||||||||||||
| |||||||||||||||||

.jpg)
Incumbent Democrat Alan J. Dixon decided to run for re-election a third term, but was defeated in the primary against Carol Moseley Braun, Cook County Recorder of Deeds and former State Representative, who then won the general election over Republican Richard S. Williamson, former Assistant Secretary of State for International Organization Affairs. Braun (whose victory coincided with Bill Clinton's win in the presidential election and Illinois) made history in this election by becoming the first African-American woman ever elected to the U.S. Senate, and also the first African-American elected to the U.S. Senate as a Democrat.
| Party | Candidate | Votes | % | |
|---|---|---|---|---|
| Democratic | Carol Moseley Braun | 557,694 | 38.0% | |
| Democratic | Alan J. Dixon (Incumbent) | 504,077 | 35.0% | |
| Democratic | Albert Hofeld | 394,497 | 18.0% | |
This defeat shocked observers; at the time no senator had been defeated in a primary in over a decade and Dixon had a long record of electoral success. He was a moderate Democrat, who recently voted to confirm Clarence Thomas to the Supreme Court.[23] Braun, a black woman and known reformist liberal, got a large share of black, liberal, and women voters ("The Year of the Woman").
In addition, she carried Cook County, Illinois, by far the most populated county in the state. Another factor was the third candidate in the race, multi-millionaire attorney Al Hofeld. Hofeld drew away some of the moderate and conservative Democrats who normally supported Dixon. He also spent a lot of money running advertisements attacking Dixon, weakening his support.
Moseley Braun won the 1992 Illinois Senate Race by a fairly comfortable margin. Moseley Braun did well as expected in Cook County home of Chicago. Williamson did well in the Chicago collar counties, and most northern parts of the state. Moseley Braun had a surprisingly strong showing in southern Illinois, which Republicans had come to dominate in the last several decades. Braun also did well in Rock Island County.
| Party | Candidate | Votes | % | ±% | |
|---|---|---|---|---|---|
| Democratic | Carol Moseley Braun | 2,631,229 | 53.3% | −3.8% | |
| Republican | Richard S. Williamson | 2,126,833 | 43.1% | +9.3% | |
| Independent | Chad Koppie | 100,422 | 2.0% | ||
| Libertarian | Andrew B. Spiegel | 34,527 | 0.7% | ||
| Natural Law | Charles A. Winter | 15,118 | N/A% | ||
| New Alliance | Alan J. Port | 12,689 | N/A% | ||
| Socialist Workers | Kathleen Kaku | 10,056 | N/A% | ||
| Populist | John Justice | 8,656 | N/A% | ||
| Total votes | 4,935,530 | 100.0% | |||
| Majority | 504,396 | 10.2% | |||
| Democratic hold | |||||
Indiana
[edit]
| |||||||||||||||||
 County results Coats: 40–50% 50–60% 60–70% 70–80% Hogsett: 40–50% 50–60% | |||||||||||||||||
| |||||||||||||||||
.jpg)
.jpg)
Incumbent Republican Dan Coats won re-election to his first full term, beating the Democratic Indiana Secretary of State Joe Hogsett.[24]
When incumbent Republican Dan Quayle resigned from the Senate after being elected Vice President of the United States in 1988, Coats was appointed to Quayle's former seat. He then won election to serve the remainder of the term in 1990.
| Party | Candidate | Votes | % | ||
|---|---|---|---|---|---|
| Republican | Dan Coats (Incumbent) | 1,267,972 | 57.3% | ||
| Democratic | Joseph Hogsett | 900,148 | 40.8% | ||
| Libertarian | Steve Dillon | 35,733 | 1.6% | ||
| New Alliance | Raymond Tirado | 7,474 | 0.3% | ||
| No party | Write-Ins | 99 | 0.0% | ||
| Majority | 367,824 | ||||
| Turnout | 2,211,426 | ||||
| Republican hold | Swing | ||||
Coats won 79 of Indiana's counties compared to 13 for Hogsett.[25]
Iowa
[edit]
| |||||||||||||||||
 County results Grassley: 50-60% 60-70% 70-80% 80-90% >90% | |||||||||||||||||
| |||||||||||||||||


Incumbent Republican Chuck Grassley ran for re-election to a third term in the United States Senate, which he won easily against his Democratic opponent, State senator Jean Hall Lloyd-Jones.
| Party | Candidate | Votes | % | |
|---|---|---|---|---|
| Democratic | Jean Hall Lloyd-Jones | 60,615 | 60.80 | |
| Democratic | Rosanne Freeburg | 38,774 | 38.89 | |
| Democratic | Write-ins | 307 | 0.31 | |
| Turnout | 99,696 | |||
| Party | Candidate | Votes | % | |
|---|---|---|---|---|
| Republican | Chuck Grassley (Incumbent) | 109,273 | 99.70 | |
| Republican | Write-ins | 324 | 0.30 | |
| Turnout | 109,597 | |||
| Party | Candidate | Votes | % | ±% | |
|---|---|---|---|---|---|
| Republican | Chuck Grassley (Incumbent) | 899,761 | 69.61 | +3.58 | |
| Democratic | Jean Hall Lloyd-Jones | 351,561 | 27.20 | −6.37 | |
| Natural Law | Stuart Zimmerman | 16,403 | 1.27 | ||
| Independent | Sue Atkinson | 6,277 | 0.49 | ||
| Independent | Mel Boring | 5,508 | 0.43 | ||
| Independent | Rosanne Freeburg | 4,999 | 0.39 | ||
| Grassroots | Carl Eric Olsen | 3,404 | 0.26 | ||
| Independent | Richard O'Dell Hughes | 2,918 | 0.23 | ||
| Socialist Workers | Cleve Andrew Pulley | 1,370 | 0.11 | ||
| Write-ins | 293 | 0.02 | |||
| Majority | 548,200 | 42.41 | +9.95 | ||
| Turnout | 1,292,494 | ||||
| Republican hold | Swing | ||||
Kansas
[edit]
| |||||||||||||||||
 County results Dole: 40–50% 50–60% 60–70% 70–80% | |||||||||||||||||
| |||||||||||||||||

Incumbent Republican senator Bob Dole won re-election to a fifth term, defeating Democratic nominee Gloria O'Dell, teacher and former journalist.[27] Nearly two decades after his failed vice-presidential bid in 1976, this would be Dole's last election to the Senate. He would resign in 1996 while running for President of the United States. Dole also became the Republican Leader of the United States Senate seven years prior.
| Party | Candidate | Votes | % | |
|---|---|---|---|---|
| Republican | Bob Dole (Incumbent) | 706,246 | 62.70% | |
| Democratic | Gloria O'Dell | 349,525 | 31.03% | |
| Independent | Christina Campbell-Cline | 45,423 | 4.03% | |
| Libertarian | Mark B. Kirk | 25,253 | 2.24% | |
| Majority | 356,721 | 31.67% | ||
| Turnout | 1,126,447 | |||
| Republican hold | ||||
Kentucky
[edit]
| |||||||||||||||||
 County results Ford: 40–50% 50–60% 60–70% 70–80% 80–90% Williams: 40–50% 50–60% 60–70% 70–80% | |||||||||||||||||
| |||||||||||||||||


Incumbent Democratic U.S. senator Wendell Ford won re-election to a fourth term, easily beating Republican State senator David L. Williams. As of 2023[update], this was the last Senate election in Kentucky in which a Democrat won.
Denny Ormerod, a machinist from Louisville dropped out before the primary election.[29] Though Williams and Thompson represented opposing factions in the state Republican Party – Williams managed Larry Hopkins' 1991 primary campaign while Thompson worked full-time for Hopkins' primary opponent Larry Forgy – the two virtually ignored each other in the primary campaign, choosing instead to focus their rhetoric against Ford.[29] Thompson did question Williams' conservative credentials on grounds that he voted in favor of the tax increase associated with the Kentucky Education Reform Act.[29] Ormerod's campaign largely focused on socially conservative issues, but it was Williams who secured the endorsement of Kentucky Right to Life, who cited his lawsuit to free three anti-abortion bills from committee in the 1992 legislative session.[29] As a result of the largely uninspiring primary campaigns, there was only an 18% voter turnout in the Republican primary. Williams won the nomination.[30]
| Party | Candidate | Votes | % | |
|---|---|---|---|---|
| Republican | David Williams | 49,880 | 60.9% | |
| Republican | Phillip Thompson | 25,026 | 30.5% | |
| Republican | Denny Ormerod | 7,066 | 8.6% | |
Ford, the Senate Majority Whip and a former governor, raised $2.4 million for his campaign, about eight times the amount Williams raised.[32] Given his limited finances, Williams relied on news conferences and interviews on small town radio stations to get his message out.[32] Williams repeatedly lamented that Ford would not agree to a formal debate; Ford said that could not be arranged because Congress was still in session and he needed to be in Washington.[33] During the campaign, Williams attempted to paint Ford as too liberal for Kentucky voters, citing his votes against the Gulf War and Clarence Thomas' confirmation to the U.S. Supreme Court.[34] Both candidates declared their support for a Balanced Budget Amendment, but Williams said that Ford's support of pork barrel projects for the state and a procedural vote that kept the amendment from a vote in 1991 were evidence that Ford's support was not genuine.[34]
Ford had no trouble winning on election night. Ford won easily, despite the fact that fellow Democrat Bill Clinton was not declared the winner of the presidential race in Kentucky until around 10:00 E.S.T. Ford pulled big margins out of the majority of Kentucky's 124 counties. This would be Ford's last term in the senate. He served his final term from January 3, 1993, to January 3, 1999. Ford died some fifteen years after his retirement at the age of 90.
| Party | Candidate | Votes | % | |
|---|---|---|---|---|
| Democratic | Wendell H. Ford (Incumbent) | 836,888 | 62.9% | |
| Republican | David L. Williams | 476,604 | 35.8% | |
| Libertarian | James A. Ridenour | 17,366 | 1.3% | |
| Total votes | 1,330,858 | 100.00% | ||
| Majority | 360,208 | 27.1% | ||
| Democratic hold | ||||
Louisiana
[edit]
| |||||||||||||||||||||||||||||||||||||
 Parish results Breaux: 50–60% 60–70% 70–80% 80–90% | |||||||||||||||||||||||||||||||||||||
| |||||||||||||||||||||||||||||||||||||

Incumbent Democrat John Breaux won a majority in Louisiana's jungle primary on October 3, 1992, winning re-election to another term.
| Party | Candidate | Votes | % | |
|---|---|---|---|---|
| Democratic | John Breaux (Incumbent) | 616,021 | 73.07% | |
| Independent | Jon Khachaturian | 74,785 | 8.87% | |
| Republican | Lyle Stocksill | 69,986 | 8.30% | |
| Democratic | Nick Joseph Accardo | 45,839 | 5.44% | |
| Republican | Fred Clegg Strong | 36,406 | 4.32% | |
| Majority | 541,236 | 64.20% | ||
| Turnout | 843,037 | |||
| Democratic hold | ||||
Maryland
[edit]
| |||||||||||||||||
 County results Mikulski: 50–60% 60–70% 70–80% 80–90% Keyes: 50–60% | |||||||||||||||||
| |||||||||||||||||

.jpg)
Incumbent Democrat Barbara Mikulski won re-election to a second term over Republican Alan Keyes, former Assistant Secretary of State for International Organization Affairs.
| Party | Candidate | Votes | % | |
|---|---|---|---|---|
| Democratic | Barbara A. Mikulski (Incumbent) | 376,444 | 76.75% | |
| Democratic | Thomas M. Wheatley | 31,214 | 6.36% | |
| Democratic | Walter Boyd | 26,467 | 5.40% | |
| Democratic | Don Allensworth | 19,731 | 4.02% | |
| Democratic | Scott David Britt | 13,001 | 2.65% | |
| Democratic | James Leonard White | 12,470 | 2.54% | |
| Democratic | B. Emerson Sweatt | 11,150 | 2.27% | |
| Total votes | 490,477 | 100.00% | ||
| Party | Candidate | Votes | % | |
|---|---|---|---|---|
| Republican | Alan L. Keyes | 95,831 | 45.94% | |
| Republican | Martha Scanlan Klima | 20,758 | 9.95% | |
| Republican | Joseph I. Cassilly | 16,091 | 7.71% | |
| Republican | Ross Z. Pierpont | 12,658 | 6.07% | |
| Republican | S. Rob Sobhani | 12,423 | 5.96% | |
| Republican | John J. Bishop, Jr. | 9,451 | 4.53% | |
| Republican | Eugene R. Zarwell | 6,535 | 3.13% | |
| Republican | James Henry Berry | 6,282 | 3.01% | |
| Republican | Romie Allen Songer | 6,030 | 2.89% | |
| Republican | Joyce Friend-Nalepka | 5,835 | 2.80% | |
| Republican | Edward Robert Shannon | 4,578 | 2.19% | |
| Republican | Scott L. Meredith | 4,372 | 2.10% | |
| Republican | Stuart Hopkins | 3,717 | 1.78% | |
| Republican | Herman J. Hannan | 2,771 | 1.33% | |
| Republican | William H. Krehnbrink | 1,258 | 0.60% | |
| Total votes | 208,590 | 100.00% | ||
| Party | Candidate | Votes | % | ±% | |
|---|---|---|---|---|---|
| Democratic | Barbara A. Mikulski (Incumbent) | 1,307,610 | 71.02% | +10.33% | |
| Republican | Alan L. Keyes | 533,688 | 28.98% | −10.33% | |
| Majority | 773,922 | 42.03% | +20.66% | ||
| Total votes | 1,841,298 | 100.00% | |||
| Democratic hold | Swing | ||||
Missouri
[edit]
| |||||||||||||||||
 County results Bond: 40-50% 50-60% 60-70% 70-80% R-Serot: 40–50% 50–60% 60–70% | |||||||||||||||||
| |||||||||||||||||

Incumbent Republican Kit Bond won re-election to a second term over Democratic St. Louis County Councilwoman Geri Rothman-Serot.[5]
| Party | Candidate | Votes | % | |
|---|---|---|---|---|
| Republican | Kit Bond (incumbent) | 1,221,901 | 51.2% | |
| Democratic | Geri Rothman-Serot | 1,057,967 | 44.9% | |
| Libertarian | Jeanne Bojarski | 75,048 | 3.2% | |
| Total votes | 2,354,916 | 100.00% | ||
| Majority | 163,934 | 6.3% | ||
| Republican hold | ||||
Nevada
[edit]
| |||||||||||||||||
 County results Reid: 40–50% 50–60% Dahl: 40–50% 50–60% 60–70% | |||||||||||||||||
| |||||||||||||||||

Although nearly 10% of the electorate voted for neither of the two major U.S. political parties, incumbent Democrat Harry Reid ultimately beat Republican cattle rancher and President of Nevada Cattlemen's Association Demar Dahl.[5]
| Party | Candidate | Votes | % | ±% | |
|---|---|---|---|---|---|
| Democratic | Harry Reid (Incumbent) | 253,150 | 51.05% | +1.05% | |
| Republican | Demar Dahl | 199,413 | 40.21% | −4.30% | |
| None of These Candidates | 13,154 | 2.65% | -0.96% | ||
| Independent American Party (Nevada) | Joe S. Garcia | 11,240 | 2.27% | ||
| Natural Law | Lois Avery | 7,279 | 1.47% | ||
| Libertarian | Kent Cromwell | 7,222 | 1.46% | −0.41% | |
| Populist | Harry Tootle | 4,429 | 0.89% | ||
| Majority | 53,737 | 10.84% | +5.36% | ||
| Turnout | 495,887 | ||||
| Democratic hold | Swing | ||||
New Hampshire
[edit]
| |||||||||||||||||
  Gregg: 40–50% 50–60% 60–70% 70–80% 80–90% >90% Rauh: 40–50% 50–60% 60–70% 80–90% Brady: >90% Tie: 50% | |||||||||||||||||
| |||||||||||||||||

Incumbent Republican Warren Rudman decided to retire. Republican Governor Judd Gregg won the open seat, beating Democrat John Rauh, former CEO of Griffon Corporation.[38]
| Party | Candidate | Votes | % | |
|---|---|---|---|---|
| Republican | Judd Gregg | 249,591 | 48.2% | |
| Democratic | John Rauh | 234,982 | 45.4% | |
| Libertarian | Katherine M. Alexander | 18,214 | 3.5% | |
| Independent | Larry Brady | 9,340 | 1.8% | |
| Independent | Ken Blevens | 4,752 | 0.9% | |
| Natural Law | David Haight | 1,291 | 0.3% | |
| Total votes | 518,170 | 100.00% | ||
| Majority | 14,609 | 2.8% | ||
| Republican hold | ||||
New York
[edit]
| |||||||||||||||||
 County results D'Amato: 40-50% 50-60% 60-70% Abrams: 40–50% 50–60% 60–70% 70–80% | |||||||||||||||||
| |||||||||||||||||


Incumbent Republican Al D'Amato won re-election to a third term over Democrat Robert Abrams, New York State Attorney General and former Borough president of the Bronx. As of 2023[update], this was the last Senate election in New York won by a Republican.
Early in the campaign, environmentalist attorney, Laurance S. Rockefeller, Jr. nephew of the former governor Nelson, tried to challenge D'Amato in the Republican primary,[40] but fell short of the required signatures to get onto the primary ballot. D'Amato summarily went unchallenged.
The Democratic primary campaign featured State Attorney General Robert Abrams, former U.S. Congresswoman and 1984 vice presidential candidate Geraldine Ferraro, Reverend Al Sharpton, Congressman Robert J. Mrazek, and New York City Comptroller and former Congresswoman Elizabeth Holtzman. Abrams was considered the early front-runner.[41] Ferraro emphasized her career as a teacher, prosecutor, congresswoman, and mother, and talked about how she was tough on crime.[42] Ferraro drew attacks from the media and her opponents over her husband John Zaccaro's finances and business relationships.[43]
Ferraro became the front-runner, capitalizing on her star power from 1984 and using the campaign attacks against her as an explicitly feminist rallying point for women voters.[43] As the primary date neared, her lead began to dwindle under the charges, and she released additional tax returns from the 1980s to try to defray the attacks.[44] Holtzman ran a negative ad accusing Ferraro and Zaccaro of taking more than $300,000 in rent in the 1980s from a pornographer with purported ties to organized crime.[45] The final debates were nasty, and Holtzman in particular constantly attacked Ferraro's integrity and finances.[46][47] In an unusual election-eve television broadcast, Ferraro talked about the ethnic slurs made against her as an Italian-American.[48] In the September 15, 1992 primary, Abrams edged out Ferraro by less than percentage point, winning 37 percent of the vote to 36 percent.[47] Ferraro did not concede she had lost for two weeks.[49]
After Abrams emerged as the nominee, the Democrats remained divided. In particular, Abrams spent much of the remainder of the campaign trying to get Ferraro's endorsement.[50] Ferraro, enraged and bitter after the nature of the primary,[46][49] ignored Abrams and accepted Bill Clinton's request to campaign for his presidential bid instead. She was eventually persuaded by state party leaders into giving an unenthusiastic endorsement with just three days to go before the general election, in exchange for an apology by Abrams for the tone of the primary.[50]
Abrams was also criticized for calling D'Amato a fascist, and he narrowly lost the general election as a result of these controversies.[51]
| Party | Candidate | Votes | % | |
|---|---|---|---|---|
| Republican | Al D'Amato | 2,652,822 | ||
| Conservative | Al D'Amato | 289,258 | ||
| Right to Life | Al D'Amato | 224,914 | ||
| Total | Al D'Amato (Incumbent) | 3,166,994 | 49.0% | |
| Democratic | Robert Abrams | 2,943,001 | ||
| Liberal | Robert Abrams | 143,199 | ||
| 'Total' | Robert Abrams | 3,086,200 | 47.8% | |
| Libertarian | Norma Segal | 108,530 | 1.7% | |
| New Alliance | Mohammad T. Mehdi | 56,631 | 0.9% | |
| Natural Law | Stanley Nelson | 23,747 | 0.4% | |
| Socialist Workers | Eddie Warren | 16,724 | 0.3% | |
| Total votes | 6,458,826 | 100.00% | ||
| Majority | 80,794 | 1.2% | ||
| Republican hold | ||||
North Carolina
[edit]
| |||||||||||||||||
 County results Faircloth: 40–50% 50–60% 60–70% 70–80% Sanford: 40–50% 50–60% 60–70% 70–80% Tie: 40–50% | |||||||||||||||||
| |||||||||||||||||


Incumbent Democrat Terry Sanford lost re-election to a second term to Republican Lauch Faircloth, former State Secretary of Commerce.
| Party | Candidate | Votes | % | |
|---|---|---|---|---|
| Republican | Lauch Faircloth | 129,159 | 47.74% | |
| Republican | Sue Wilkins Myrick | 81,801 | 30.23% | |
| Republican | Eugene Johnston | 46,112 | 17.04% | |
| Republican | Larry Harrington | 13,496 | 4.99% | |
| Turnout | 270,568 | |||
In 1990, after 40 years as a Democrat, Faircloth switched his party registration and began preparations to seek the Republican Senate nomination in 1992. Enjoying the support of senator Jesse Helms's political organization, Faircloth defeated Charlotte mayor Sue Myrick and former congressman Walter E. Johnston, III in the primary. His opponent in the general election was his former ally, Terry Sanford. Although Sanford had helped Faircloth raise money for his failed gubernatorial bid in 1984, he angered Faircloth two years later when he allegedly dismissed Faircloth's chances in a statewide contest if the two ran against each other for the Democratic nomination for the Senate.[54] Faircloth withdrew from the 1986 race after Sanford "blindsided" him by announcing his candidacy.[55]
Faircloth attacked Sanford as a tax-and-spend liberal, and despite a poor performance in a September televised debate, Faircloth won the seat by a 100,000-vote margin. Sanford may have been weakened by his unpopular vote against authorizing military force in the Persian Gulf War, and he suffered health problems in the summer of 1992.[56]
| Party | Candidate | Votes | % | ±% | |
|---|---|---|---|---|---|
| Republican | Lauch Faircloth | 1,297,892 | 50.35% | +2.11% | |
| Democratic | Terry Sanford (Incumbent) | 1,194,015 | 46.32% | –5.44% | |
| Libertarian | Bobby Yates Emory | 85,948 | 3.33% | N/A | |
| Turnout | 2,577,855 | ||||
| Majority | 103,877 | 4.03% | |||
| Republican gain from Democratic | Swing | ||||
North Dakota
[edit]Due to the death of Quentin Burdick in September of that year, there were two senate elections in North Dakota.