
 French
 Deutsch
File:Eu-estimation-tolerance-absolute.svg

Size of this PNG preview of this SVG file: 300 × 300 pixels. Other resolutions: 240 × 240 pixels | 480 × 480 pixels | 768 × 768 pixels | 1,024 × 1,024 pixels | 2,048 × 2,048 pixels.
Original file (SVG file, nominally 300 × 300 pixels, file size: 10 KB)
| This is a file from the Wikimedia Commons. Information from its description page there is shown below. Commons is a freely licensed media file repository. You can help. |
Summary
| Description | |
| Date | |
| Source | Self-made in gnuplot. |
| Author | Nils R. Barth |
| Other versions | File:Eu-estimation-tolerance-relative.svg (relative tolerances) |
gnuplot source
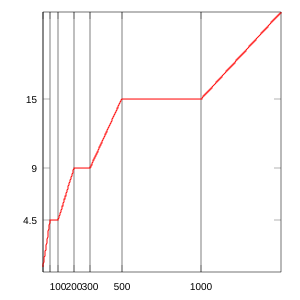
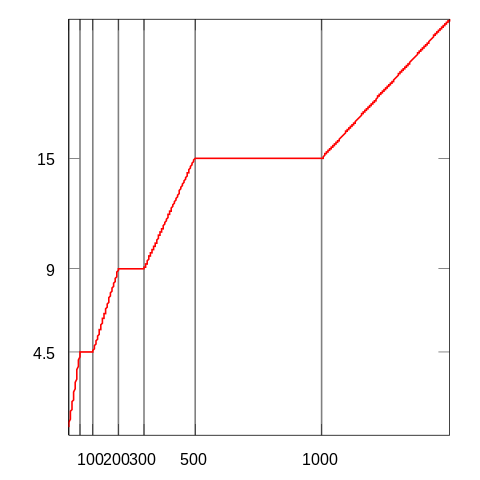
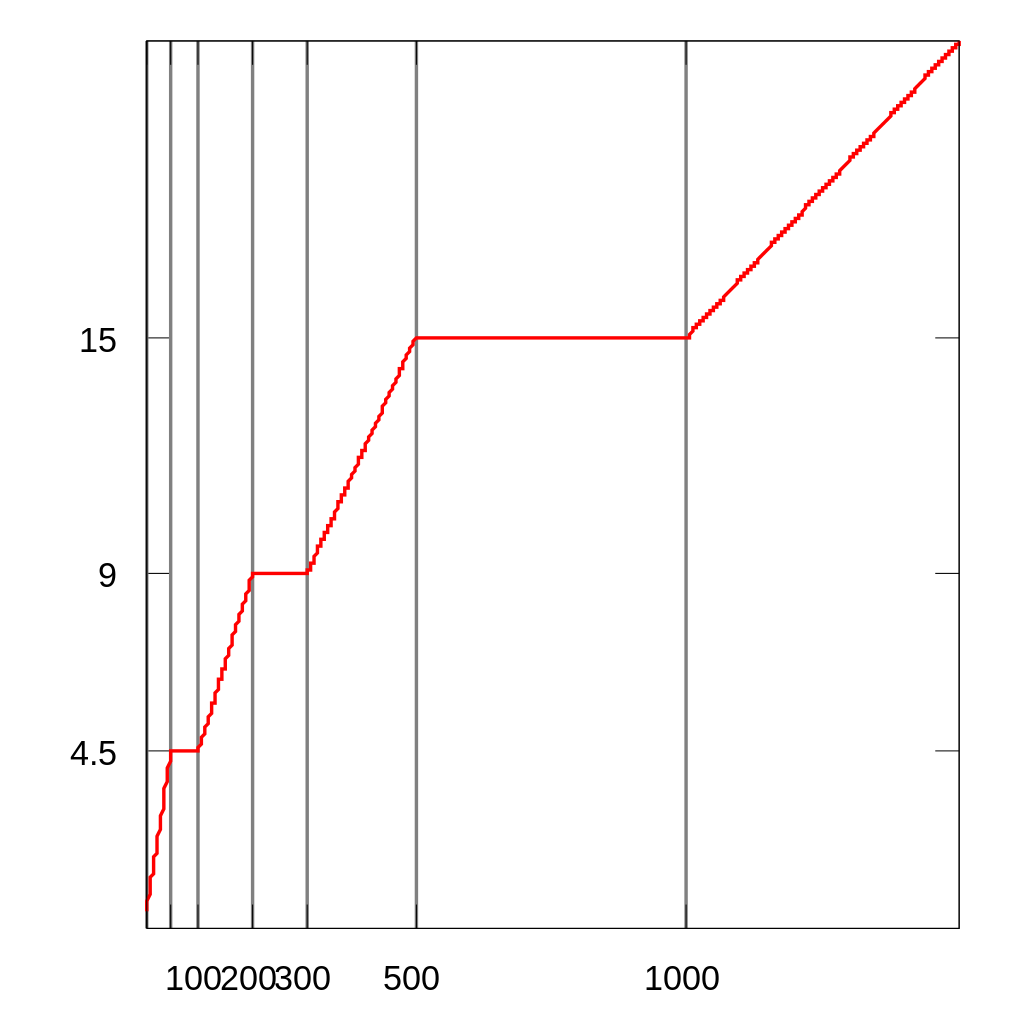
# Graphs of errors for the EU “estimated sign” # Set terminal set terminal svg enhanced size 300 300 fs 10 set samples 1001 # high quality set border 31 linewidth .3 # thin border unset key # no key # Tolerable error function: # input is nominal quantity # output is tolerable negative error, as an absolute quantity # # e(x)/x is thus tolerable ~relative~ error # e(x) = x < 50 ? 9e-2 * x \ : x < 100 ? 4.5 \ : x < 200 ? 4.5e-2 * x \ : x < 300 ? 9 \ : x < 500 ? 3e-2 * x \ : x < 1000 ? 15 \ : 1.5e-2 * x # X-range and x-tics # Set x tics at the cutoff points set xtics ("" 5, "" 50, "100" 100, "200" 200, "300" 300, "500" 500, "1000" 1000) # Set representative x-range: # undefined below 5, and # extending above 1500 to 10,000 just shrinks the interesting part of the graph # # (A log-scale on the x-axis would fit everything in, but obscure the linearity # in the absolute error; it would be ok in the relative error though.) set xrange [5:1500] # Draw the x grid, to show ranges set grid x #################### # Absolute error #################### # Set y tics at the fixed amounts set ytics (4.5,9,15) # Set y-range to go from 0 to max (over this x-range) set yrange [0:22.5] set output "eu-estimation-tolerance-absolute.svg" plot e(x) #################### # Relative error #################### # Set y-tics at the fixed percentages set ytics (1.5, 3, 4.5, 9) # Set y-range (0% – 10%) to include all percentages, with clearance for 9%. set yrange [0:10] set format y "%g %%" # Format as percentage set output "eu-estimation-tolerance-relative.svg" # Multiply by 100 so as a percentage plot e(x)/x*100 Licensing
Nils R. Barth, the copyright holder of this work, hereby publishes it under the following license:
| I, the copyright holder of this work, release this work into the public domain. This applies worldwide. In some countries this may not be legally possible; if so: I grant anyone the right to use this work for any purpose, without any conditions, unless such conditions are required by law. |
File history
Click on a date/time to view the file as it appeared at that time.
| Date/Time | Thumbnail | Dimensions | User | Comment | |
|---|---|---|---|---|---|
| current | 03:24, 25 March 2009 | | 300 × 300 (10 KB) | Nbarth | Thinner border. |
| 03:09, 25 March 2009 |  | 300 × 300 (8 KB) | Nbarth | Fix nominal size so agrees with target size (300, not 1000). | |
| 02:56, 25 March 2009 |  | 1,000 × 1,000 (13 KB) | Nbarth | Smaller text to avoid collision | |
| 02:54, 25 March 2009 |  | 1,000 × 1,000 (13 KB) | Nbarth | Thicker lines, bigger text | |
| 02:01, 25 March 2009 |  | 1,000 × 1,000 (14 KB) | Nbarth | {{Information |Description={{en|1=Absolute estimation tolerances for the European Union estimated sign.}} |Source=Own work by uploader |Author=Nbarth |Date=2009-03-25 |Permission= |other_versio |
File usage
The following pages on the English Wikipedia use this file (pages on other projects are not listed):
Global file usage
The following other wikis use this file:
- Usage on ca.wikipedia.org
- Usage on es.wikipedia.org
- Usage on fa.wikipedia.org
- Usage on ja.wikipedia.org