
 French
 Deutsch
File:Global Map of Oceanic Plate Age by Fabio Crameri.png
Size of this preview: 800 × 533 pixels. Other resolutions: 320 × 213 pixels | 640 × 426 pixels | 1,024 × 682 pixels | 1,280 × 853 pixels | 2,953 × 1,967 pixels.
Original file (2,953 × 1,967 pixels, file size: 4.45 MB, MIME type: image/png)
| This is a file from the Wikimedia Commons. Information from its description page there is shown below. Commons is a freely licensed media file repository. You can help. |
Summary
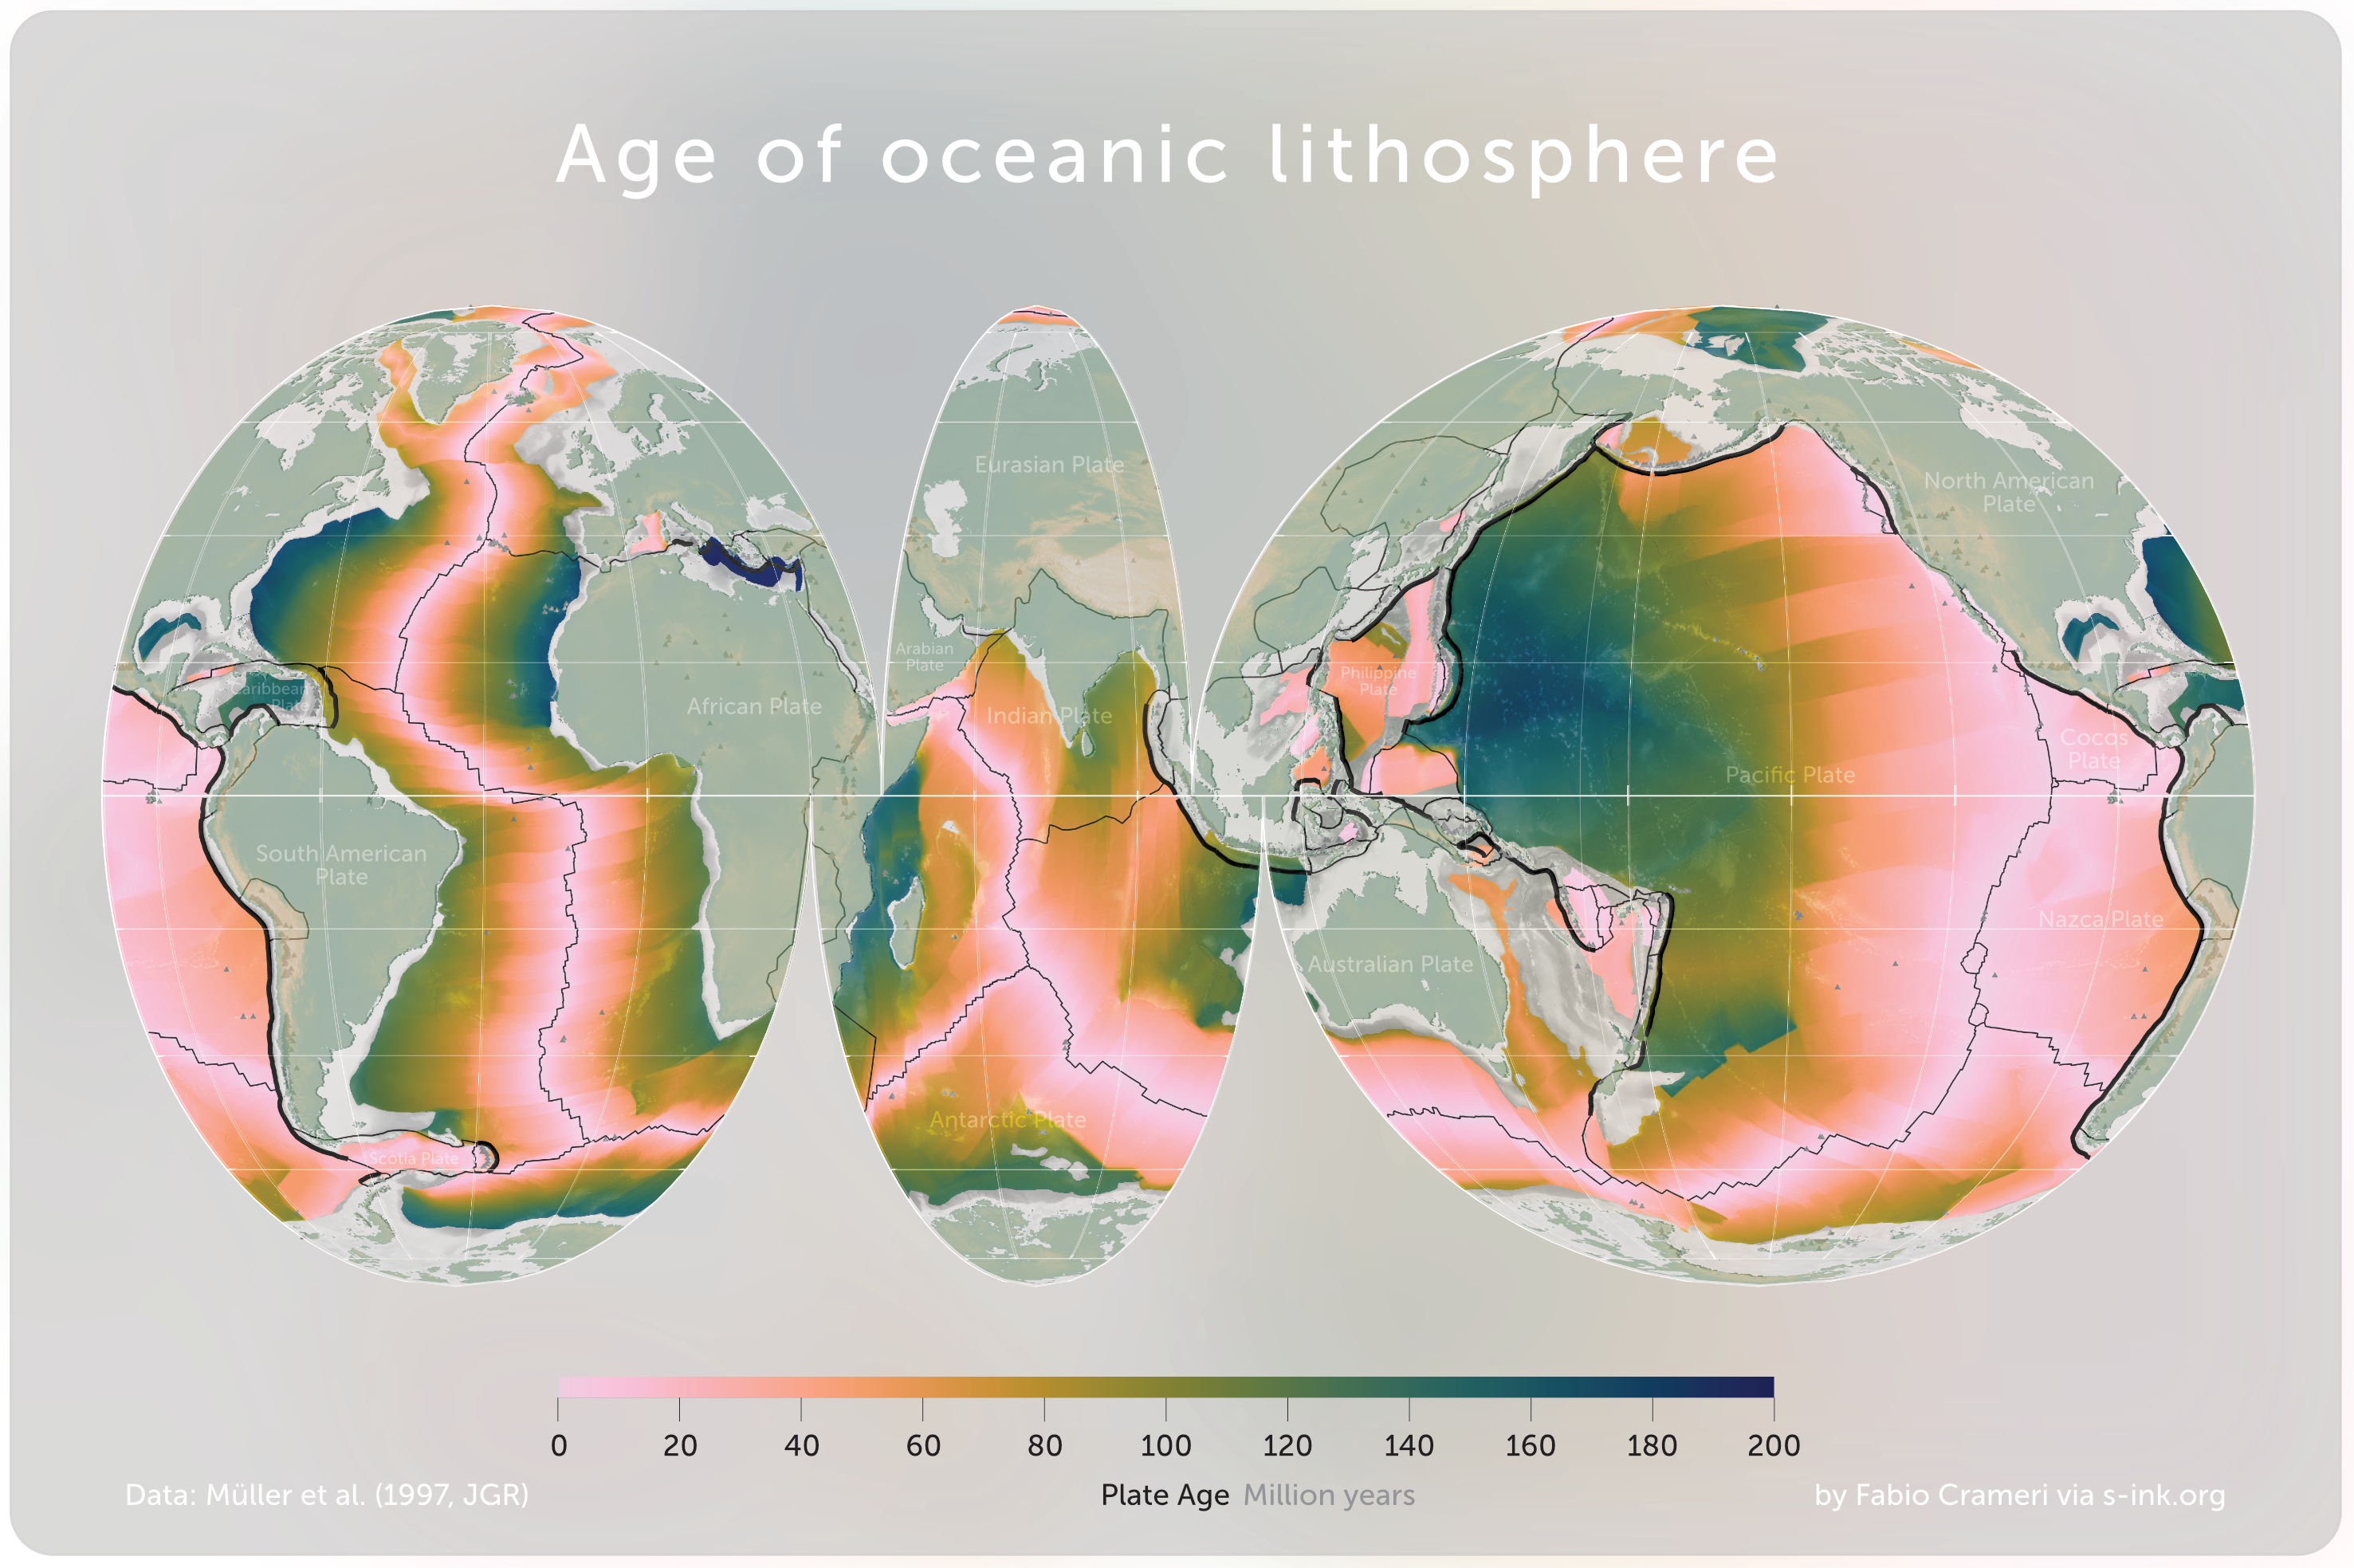
| Description | English: Visually accessible global maps of oceanic plate age designed for color-blind readers by Fabio Crameri and shared openly via https://s-ink.org/oceanic-plate-age-poster . Highlighted are subduction zones (wide black lines) and other plate boundaries (thin black lines). Plate ages range from 0 (depicted in light colours) to approximately 200 Million years (depicted in dark colours), illustrating the dynamic process of ongoing plate motion and recycling through ocean-plate tectonics. This comprehensive representation is based on global oceanic plate age data from Müller et al. (1997), visualised on a custom Interrupted Mollweide map projection developed by Crameri et al. (2020a), with a specific focus on the world’s oceans. The ‘batlow‘ Scientific color map (Crameri et al., 2020b) ensures accurate data representation and inclusivity for all readers. Müller, R. D., et al. (1997). “Digital isochrons of the world’s ocean floor.” J. Geophys. Res. 102(B2): 3211-3214. Crameri, F., V. Magni, M. Domeier, G.E. Shephard, K. Chotalia, G. Cooper, C. Eakin, A.G. Grima, D. Gürer, A. Király, E. Mulyukova, K. Peters, B. Robert, and M. Thielmann (2020a), A transdisciplinary and community-driven database to unravel subduction zone initiation, Nature Communications, 11, 3750. doi:10.1038/s41467-020-17522-9 Crameri, F., G.E. Shephard, and P.J. Heron (2020b), The misuse of colour in science communication, Nature Communications, 11, 5444. doi:10.1038/s41467-020-19160-7 |
| Date | |
| Source | Own work |
| Author | FCrameri |
Licensing
I, the copyright holder of this work, hereby publish it under the following license:
This file is licensed under the Creative Commons Attribution-Share Alike 4.0 International license.
- You are free:
- to share – to copy, distribute and transmit the work
- to remix – to adapt the work
- Under the following conditions:
- attribution – You must give appropriate credit, provide a link to the license, and indicate if changes were made. You may do so in any reasonable manner, but not in any way that suggests the licensor endorses you or your use.
- share alike – If you remix, transform, or build upon the material, you must distribute your contributions under the same or compatible license as the original.
File history
Click on a date/time to view the file as it appeared at that time.
| Date/Time | Thumbnail | Dimensions | User | Comment | |
|---|---|---|---|---|---|
| current | 10:13, 19 November 2023 | | 2,953 × 1,967 (4.45 MB) | FCrameri | Uploaded own work with UploadWizard |
File usage
The following 2 pages use this file: