
 French
 Deutsch
File:Isomap on Swiss roll.png
Original file (1,990 × 1,989 pixels, file size: 1.92 MB, MIME type: image/png)
| This is a file from the Wikimedia Commons. Information from its description page there is shown below. Commons is a freely licensed media file repository. You can help. |
Summary
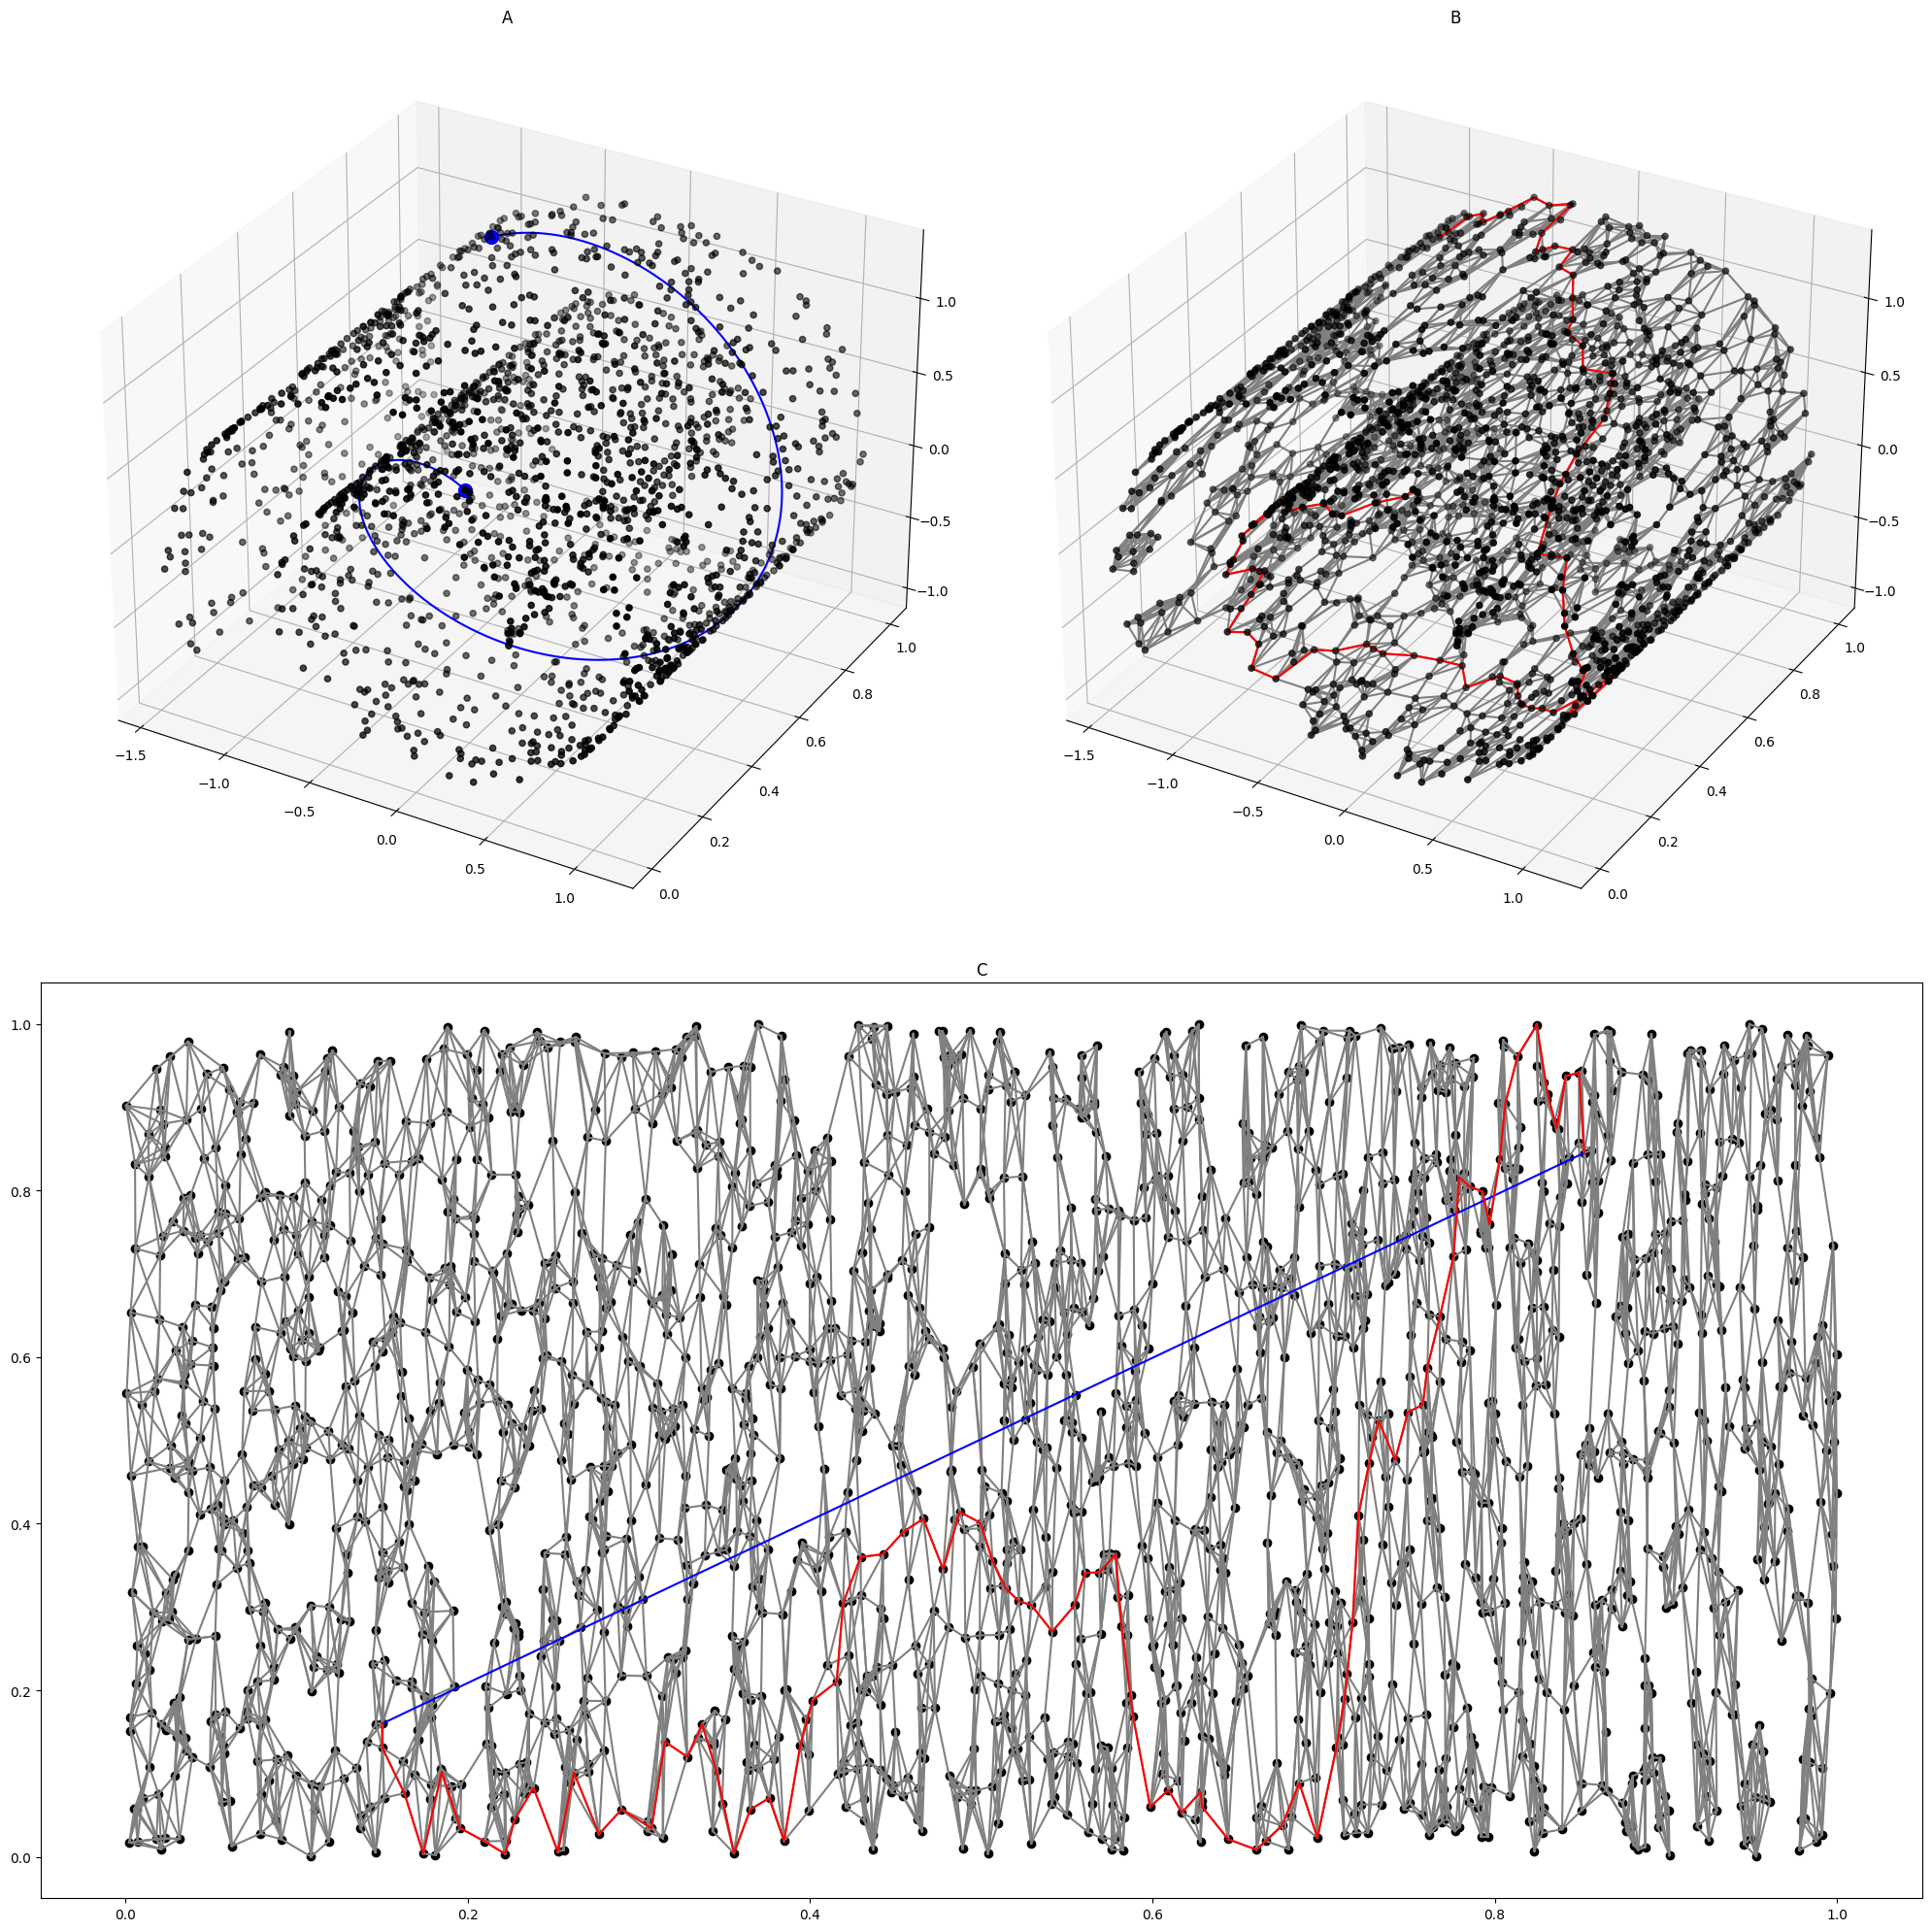
| Description | English: Replication of Figure 3 of A global geometric framework for nonlinear dimensionality reduction JB Tenenbaum, V Silva, JC Langford - science, 2000 ```python import matplotlib.pyplot as plt from mpl_toolkits.mplot3d import Axes3D import numpy as np from scipy.spatial import KDTree from networkx import Graph, shortest_path import networkx as nx
N = 2000 K=7 x = np.random.rand(N,2) def F(X): if X.ndim == 1: X = X[None,:] X1 = X[:,0] X2 = X[:,1] Y1 = (X1 + 0.5)*np.cos(10*X1) Y2 = X2 Y3 = (X1 + 0.5)*np.sin(10*X1) return np.column_stack((Y1, Y2, Y3)) y = F(x)
x_left_id = np.argmin(np.sum((x - [0.15,0.15])**2, axis=1)) x_right_id = np.argmin(np.sum((x - [0.85,0.85])**2, axis=1)) x_left = x[x_left_id] x_right = x[x_right_id]
knn = KDTree(y) G_y = nx.Graph() for i in range(N): idx = knn.query([y[i]], k=K)[1][0] for j in idx: G_y.add_edge(i,j) G_x = nx.Graph()
for e in G_y.edges: G_x.add_edge(e[0], e[1])
path_x = shortest_path(G_x, x_left_id, x_right_id, 'weight') path_y = [p for p in shortest_path(G_y, x_left_id, x_right_id, 'weight')]
fig = plt.figure(figsize=(20, 20))
ax = fig.add_subplot(221, projection='3d') ax.scatter(y[:,0], y[:,1], y[:,2], c='k') ax.scatter(F(x_left)[0,0], F(x_left)[0,1], F(x_left)[0,2], c='b', marker='o', s=100) ax.scatter(F(x_right)[0,0], F(x_right)[0,1], F(x_right)[0,2], c='b', marker='o', s=100) t = np.linspace(0,1,1000) ax.plot(F(x_left + t[:,None]*(x_right-x_left))[:,0], F(x_left + t[:,None]*(x_right-x_left))[:,1], F(x_left + t[:,None]*(x_right-x_left))[:,2], c='b') ax.set_title('A')
ax = fig.add_subplot(222, projection='3d') ax.scatter(y[:,0], y[:,1], y[:,2], c='k') for e in G_y.edges: ax.plot(y[e,0], y[e,1], y[e,2], c='grey') ax.plot(np.array(y)[path_y,0], np.array(y)[path_y,1], np.array(y)[path_y,2], c='r') ax.set_title('B')
ax = fig.add_subplot(212) ax.scatter(x[:,0], x[:,1], c='k') for e in G_x.edges: ax.plot(x[e,0], x[e,1], c='grey') ax.plot([x_left[0], x_right[0]], [x_left[1], x_right[1]], c='b') ax.plot(np.array(x)[path_x,0], np.array(x)[path_x,1], c='r') ax.set_title('C') plt.tight_layout() plt.show() ``` |
| Date | |
| Source | Own work |
| Author | Cosmia Nebula |
Licensing
- You are free:
- to share – to copy, distribute and transmit the work
- to remix – to adapt the work
- Under the following conditions:
- attribution – You must give appropriate credit, provide a link to the license, and indicate if changes were made. You may do so in any reasonable manner, but not in any way that suggests the licensor endorses you or your use.
- share alike – If you remix, transform, or build upon the material, you must distribute your contributions under the same or compatible license as the original.
 | This media file is uncategorized. Please help improve this media file by adding it to one or more categories, so it may be associated with related media files (how?), and so that it can be more easily found. Please notify the uploader with {{subst:Please link images|File:Isomap on Swiss roll.png}} ~~~~ |
File history
Click on a date/time to view the file as it appeared at that time.
| Date/Time | Thumbnail | Dimensions | User | Comment | |
|---|---|---|---|---|---|
| current | 03:57, 30 July 2023 | | 1,990 × 1,989 (1.92 MB) | Cosmia Nebula | Uploaded while editing "Isomap" on en.wikipedia.org |