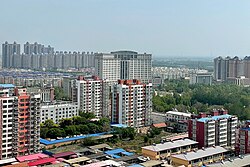
Nangong
Nangong 南宫市 Nankung | |
|---|---|
 | |
 Nangong in Xingtai | |
| Coordinates: 37°21′32″N 115°24′32″E / 37.359°N 115.409°E | |
| Country | People's Republic of China |
| Province | Hebei |
| Prefecture-level city | Xingtai |
| Area | |
| • County-level city | 863.3 km2 (333.3 sq mi) |
| • Urban | 53.50 km2 (20.66 sq mi) |
| Population (2017) | |
| • County-level city | 523,000 |
| • Urban | 149,500 |
| Time zone | UTC+8 (China Standard) |
Nangong (simplified Chinese: 南宫; traditional Chinese: 南宮; pinyin: Nángōng) is a county-level city in the south of Hebei province, China. It is administered by the prefecture-level city of Xingtai.
The city's population was 82,500 as of 2005.
Nangong county was initially created in Western Han dynasty, many locals engaged in martial arts, Nangong is famous of "hometown of martial arts".
Administrative divisions
[edit]Subdistricts:
- Fenggang Subdistrict (凤岗街道), Nandu Subdistrict (南杜街道), Beihu Subdistrict (北胡街道), Xiding Subdistrict (西丁街道)[2]
Towns:
Townships:
- Dacun Township (大村乡), Nanbiancun Township (南便村乡), Datun Nownship (大屯乡), Wangdaozhai Township (王道寨乡), Xuewucun Township (薛吴村乡)
Climate
[edit]| Climate data for Nangong (1991–2020 normals, extremes 1981–2010) | |||||||||||||
|---|---|---|---|---|---|---|---|---|---|---|---|---|---|
| Month | Jan | Feb | Mar | Apr | May | Jun | Jul | Aug | Sep | Oct | Nov | Dec | Year |
| Record high °C (°F) | 17.7 (63.9) | 25.0 (77.0) | 32.1 (89.8) | 35.0 (95.0) | 40.8 (105.4) | 41.1 (106.0) | 41.5 (106.7) | 37.3 (99.1) | 37.7 (99.9) | 32.0 (89.6) | 27.2 (81.0) | 22.9 (73.2) | 41.5 (106.7) |
| Mean daily maximum °C (°F) | 3.6 (38.5) | 8.0 (46.4) | 15.1 (59.2) | 22.2 (72.0) | 28.1 (82.6) | 32.5 (90.5) | 32.3 (90.1) | 30.7 (87.3) | 27.2 (81.0) | 21.3 (70.3) | 12.2 (54.0) | 5.1 (41.2) | 19.9 (67.8) |
| Daily mean °C (°F) | −2.4 (27.7) | 1.6 (34.9) | 8.5 (47.3) | 15.5 (59.9) | 21.7 (71.1) | 26.3 (79.3) | 27.4 (81.3) | 25.8 (78.4) | 21.2 (70.2) | 14.6 (58.3) | 6.1 (43.0) | −0.6 (30.9) | 13.8 (56.9) |
| Mean daily minimum °C (°F) | −7.0 (19.4) | −3.3 (26.1) | 2.8 (37.0) | 9.5 (49.1) | 15.6 (60.1) | 20.6 (69.1) | 23.1 (73.6) | 21.7 (71.1) | 16.3 (61.3) | 9.2 (48.6) | 1.3 (34.3) | −4.8 (23.4) | 8.8 (47.8) |
| Record low °C (°F) | −19.1 (−2.4) | −15.8 (3.6) | −8.5 (16.7) | −2.6 (27.3) | 4.3 (39.7) | 10.2 (50.4) | 17.1 (62.8) | 13.6 (56.5) | 5.4 (41.7) | −3.5 (25.7) | −12.7 (9.1) | −19.4 (−2.9) | −19.4 (−2.9) |
| Average precipitation mm (inches) | 3.1 (0.12) | 7.5 (0.30) | 9.3 (0.37) | 28.4 (1.12) | 42.4 (1.67) | 55.9 (2.20) | 131.7 (5.19) | 103.6 (4.08) | 42.1 (1.66) | 26.5 (1.04) | 16.5 (0.65) | 3.7 (0.15) | 470.7 (18.55) |
| Average precipitation days (≥ 0.1 mm) | 2.1 | 3.2 | 2.8 | 5.2 | 6.1 | 7.2 | 10.8 | 9.6 | 6.4 | 4.7 | 3.7 | 2.6 | 64.4 |
| Average snowy days | 3.2 | 3.0 | 1.0 | 0.2 | 0 | 0 | 0 | 0 | 0 | 0 | 1.1 | 2.3 | 10.8 |
| Average relative humidity (%) | 60 | 56 | 50 | 54 | 56 | 57 | 75 | 79 | 72 | 65 | 66 | 64 | 63 |
| Mean monthly sunshine hours | 160.0 | 166.5 | 220.0 | 233.3 | 264.5 | 238.5 | 199.4 | 199.4 | 190.4 | 186.3 | 156.2 | 154.6 | 2,369.1 |
| Percent possible sunshine | 52 | 54 | 59 | 59 | 60 | 54 | 45 | 48 | 52 | 54 | 52 | 52 | 53 |
| Source: China Meteorological Administration[3][4] | |||||||||||||
References
[edit]- ^ a b Ministry of Housing and Urban-Rural Development, ed. (2019). China Urban Construction Statistical Yearbook 2017. Beijing: China Statistics Press. p. 46. Retrieved 11 January 2020.
- ^ 邢台市-行政区划网
- ^ 中国气象数据网 – WeatherBk Data (in Simplified Chinese). China Meteorological Administration. Retrieved 26 August 2023.
- ^ 中国气象数据网 (in Simplified Chinese). China Meteorological Administration. Retrieved 26 August 2023.


 French
 Deutsch