Plymouth City Council elections
Plymouth City Council is the local authority for the a unitary authority of Plymouth in Devon, England. Until 1 April 1998 it was a non-metropolitan district.
Political control
[edit]Since the first election to the council in 1973 following the reforms of the Local Government Act 1972, political control of the council has been held by the following parties:[1][2]
Non-metropolitan district
[edit]| Election | Labour | Conservatives | SDP–Liberal Alliance | Independent Conservative | Party in control | |
|---|---|---|---|---|---|---|
| 1973 | 29 | 37 | Conservative | |||
| 1976 | 27 | 39 | ||||
| 1979 | 26 | 33 | 1 | |||
| 1983 | 23 | 34 | 3 | |||
| 1987 | 19 | 31 | 10 | |||
| 1991 | 41 | 19 | Labour | |||
| 1995 | 54 | 6 | ||||
Unitary authority
[edit]Election summary
[edit]After 2003, the council was elected in thirds. The number of councillors for each party following each election is listed in the table.
| Election | Labour | Conservative | Liberal Democrats | UKIP | Green | Ind. All. | Independent |
|---|---|---|---|---|---|---|---|
| 1997 | 47 | 13 | |||||
| 2000 | 22 | 38 | |||||
| 2003 | 36 | 18 | 3 | ||||
| 2004 | 35 | 19 | 2 | ||||
| 2006 | 28 | 25 | 3 | 1 | |||
| 2007 | 26 | 31 | |||||
| 2008 | 20 | 37 | |||||
| 2010 | 20 | 36 | 1 | ||||
| 2011 | 25 | 31 | 1 | ||||
| 2012 | 31 | 26 | |||||
| 2014 | 30 | 24 | 3 | ||||
| 2015 | 28 | 26 | 3 | ||||
| 2016 | 27 | 27 | 3 | ||||
| 2018 | 31 | 26 | |||||
| 2019 | 31 | 25 | 1 | ||||
| 2021 | 24 | 26 | 7 | ||||
| 2022 | 24 | 24 | 1 | 8 | |||
| 2023 | 31 | 18 | 2 | 3 | 2 |
Council elections
[edit]Non-metropolitan district elections
[edit]- 1973 Plymouth City Council election
- 1976 Plymouth City Council election
- 1979 Plymouth City Council election (New ward boundaries)[3]
- 1983 Plymouth City Council election
- 1987 Plymouth City Council election (City boundary changes took place but the number of seats remained the same)[4]
- 1991 Plymouth City Council election
- 1995 Plymouth City Council election
Unitary authority elections
[edit]- 1997 Plymouth City Council election
- 2000 Plymouth City Council election
- 2003 Plymouth City Council election (New ward boundaries reduced the number of seats by 3)[5][6][7]
- 2004 Plymouth City Council election
- 2006 Plymouth City Council election
- 2007 Plymouth City Council election
- 2008 Plymouth City Council election
- 2010 Plymouth City Council election
- 2011 Plymouth City Council election
- 2012 Plymouth City Council election
- 2014 Plymouth City Council election
- 2015 Plymouth City Council election
- 2016 Plymouth City Council election[8][9]
- 2018 Plymouth City Council election
- 2019 Plymouth City Council election
- 2021 Plymouth City Council election
- 2022 Plymouth City Council election
- 2023 Plymouth City Council election
- 2024 Plymouth City Council election
Result maps
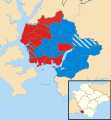
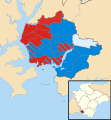
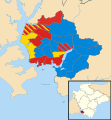
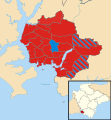
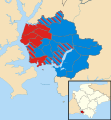
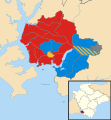
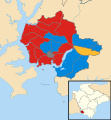
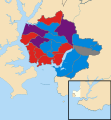
[edit]- 1979 results map
- 1983 results map
- 1987 results map
- 1991 results map
- 1995 results map
- 1997 results map
- 2000 results map
- 2003 results map
- 2004 results map
- 2006 results map
- 2007 results map
- 2008 results map
- 2010 results map
- 2011 results map
- 2012 results map
- 2014 results map
- 2015 results map
- 2016 results map
- 2018 results map
- 2019 results map
- 2021 results map
- 2022 results map
- 2023 results map
- 2024 results map
By-elections
[edit]1997-2000
[edit]| Party | Candidate | Votes | % | ±% | |
|---|---|---|---|---|---|
| Labour | 1,328 | 61.1 | −11.3 | ||
| Conservative | 420 | 19.3 | −8.3 | ||
| Liberal Democrats | 344 | 15.8 | +15.8 | ||
| Independent | 67 | 3.1 | +3.1 | ||
| Independent Democrat | 14 | 0.6 | +0.6 | ||
| Majority | 908 | 41.8 | |||
| Turnout | 2,173 | 23.0 | |||
| Labour hold | Swing | ||||
| Party | Candidate | Votes | % | ±% | |
|---|---|---|---|---|---|
| Labour | 1,017 | 65.5 | +4.8 | ||
| Conservative | 307 | 19.8 | −2.3 | ||
| Liberal Democrats | 173 | 11.1 | +11.1 | ||
| Independent Democrat | 56 | 3.6 | −13.6 | ||
| Majority | 710 | 45.7 | |||
| Turnout | 1,553 | ||||
| Labour hold | Swing | ||||
2000-2003
[edit]| Party | Candidate | Votes | % | ±% | |
|---|---|---|---|---|---|
| Labour | 1,179 | ||||
| Labour | 1,101 | ||||
| Liberal Democrats | 590 | ||||
| Liberal Democrats | 566 | ||||
| Conservative | 464 | ||||
| Conservative | 449 | ||||
| Green | 120 | ||||
| Green | 119 | ||||
| UKIP | 51 | ||||
| Turnout | 4,639 | 29.9 | |||
| Labour hold | Swing | ||||
| Labour gain from Conservative | Swing | ||||
| Party | Candidate | Votes | % | ±% | |
|---|---|---|---|---|---|
| Labour | 1,253 | 55.7 | +8.9 | ||
| Conservative | 715 | 31.8 | −6.7 | ||
| Liberal Democrats | 282 | 12.5 | +0.0 | ||
| Majority | 538 | 23.9 | |||
| Turnout | 2,250 | 25.5 | |||
| Labour hold | Swing | ||||
2003-2006
[edit]| Party | Candidate | Votes | % | ±% | |
|---|---|---|---|---|---|
| Labour | James Kirk | 1,624 | 43.3 | +3.9 | |
| Conservative | Brenda Brookshaw | 1,517 | 40.5 | +0.3 | |
| Liberal Democrats | Terrance O'Connor | 214 | 5.7 | −14.7 | |
| BNP | Liam Birch | 200 | 5.3 | +5.3 | |
| UKIP | Thomas Williams | 139 | 3.7 | +3.7 | |
| Green | Raymond Tuohy | 53 | 1.4 | +1.4 | |
| Majority | 107 | 2.8 | |||
| Turnout | 3,747 | 40.4 | |||
| Labour hold | Swing | ||||
2006-2010
[edit]| Party | Candidate | Votes | % | ±% | |
|---|---|---|---|---|---|
| Labour | Tina Tuohy | 1,243 | 44.0 | +2.7 | |
| Conservative | Nigel Churchill | 676 | 23.9 | −15.7 | |
| UKIP | Andrew Leigh | 442 | 15.6 | +15.6 | |
| Independent | Margaret Storer | 204 | 7.2 | +7.2 | |
| Liberal Democrats | Rebecca Trimnell | 181 | 6.4 | −6.8 | |
| BNP | Adrian Romilly | 82 | 2.9 | +2.9 | |
| Majority | 567 | 20.1 | |||
| Turnout | 2,828 | 29.0 | |||
| Labour hold | Swing | ||||
2010-2014
[edit]| Party | Candidate | Votes | % | ±% | |
|---|---|---|---|---|---|
| Labour | Jonny Morris | 1,247 | 43.1 | −8.2 | |
| UKIP | Peter David Berrow | 764 | 26.4 | +4.6 | |
| Conservative | David Alexander Downie | 487 | 16.8 | −10.0 | |
| Independent | Dennis Law Silverwood | 290 | 10.0 | +10.0 | |
| Liberal Democrats | Justin Dominic Stafford | 82 | 2.8 | +2.8 | |
| TUSC | Ryan Aldred | 22 | 22 0.8 | +0.8 | |
| Majority | 483 | ||||
| Turnout | 29.24 | ||||
| Labour hold | Swing | ||||
2018-2022
[edit]| Party | Candidate | Votes | % | ±% | |
|---|---|---|---|---|---|
| Labour | Jemima Laing | 1,427 | 52.8% | +0.2% | |
| Conservative | Kathy Watkin | 981 | 36.3% | +2.8% | |
| Liberal Democrats | Connor Clarke | 174 | 6.4% | +1.4% | |
| Active for Plymouth | Iuliu Popescue | 123 | 4.5% | +4.5% | |
| Majority | |||||
| Turnout | |||||
| Labour hold | Swing | ||||
2022-2026
[edit]| Party | Candidate | Votes | % | ±% | |
|---|---|---|---|---|---|
| Labour | Will Noble | 1,415 | 53.2 | +16.7 | |
| Conservative | Andrea Johnson | 877 | 33.0 | −21.0 | |
| Independent | Gavin Marshall | 184 | 6.9 | +6.9 | |
| Green | Frank Hartkopf | 87 | 3.3 | −0.7 | |
| Liberal Democrats | Colin Mackenzie | 77 | 2.9 | −1.5 | |
| TUSC | Andrew White | 18 | 0.7 | −0.4 | |
| Majority | 538 | 20.2 | |||
| Turnout | 2,658 | ||||
| Labour gain from Conservative | Swing | ||||
| Party | Candidate | Votes | % | ±% | |
|---|---|---|---|---|---|
| Green | Lauren McLay | 653 | 44.9 | −12.8 | |
| Conservative | Ashley Ward | 425 | 29.2 | −5.7 | |
| Independent | Andrew Hill | 182 | 12.5 | +12.5 | |
| Labour | Lindsay Gilmour | 147 | 10.1 | +2.7 | |
| Liberal Democrats | Mike Gillbard | 33 | 2.3 | +2.3 | |
| TUSC | Benjamin Davy | 15 | 1.0 | +1.0 | |
| Majority | 228 | 15.7 | |||
| Turnout | 1,455 | ||||
| Green gain from Conservative | Swing | ||||
| Party | Candidate | Votes | % | ±% | |
|---|---|---|---|---|---|
| Labour | Paul McNamara | 1,204 | 58.8 | −0.1 | |
| Conservative | Will Jones | 423 | 20.6 | −1.0 | |
| Green | Pat Bushell | 196 | 9.6 | −2.1 | |
| Liberal Democrats | Alexander Primmer | 80 | 3.9 | −1.5 | |
| Independent | Chaz Singh | 69 | 3.4 | +3.4 | |
| Heritage | Darryl Ingram | 54 | 2.6 | +2.6 | |
| TUSC | Neil Prentice | 23 | 1.1 | −1.3 | |
| Majority | 781 | 38.1 | |||
| Turnout | 2,049 | ||||
| Labour hold | Swing | ||||
| Party | Candidate | Votes | % | ±% | |
|---|---|---|---|---|---|
| Labour | Stefan Krizanac | 1,072 | 33.2 | −17.5 | |
| Conservative | Julie Hunt | 919 | 28.4 | −1.7 | |
| Liberal Democrats | Peter Edwards | 596 | 18.4 | +13.6 | |
| Independent | Grace Stickland | 480 | 14.9 | +14.9 | |
| Green | Bruce Robinson | 97 | 3.0 | −0.7 | |
| Heritage | Darryl Ingram | 55 | 1.7 | +1.3 | |
| TUSC | Jackie Hilton | 12 | 0.4 | −0.1 | |
| Majority | 153 | 4.7 | |||
| Turnout | 3,231 | ||||
| Labour gain from Conservative | Swing | ||||
| Party | Candidate | Votes | % | ±% | |
|---|---|---|---|---|---|
| Labour | Alison Raynsford | 1,126 | 48.0 | +0.0 | |
| Conservative | Ian Fleming | 488 | 20.8 | +2.6 | |
| Green | Shayna Newham-Joynes | 206 | 8.8 | −1.8 | |
| Liberal Democrats | Hugh Janes | 175 | 7.5 | +0.6 | |
| Reform UK | Andy Gibbons | 174 | 7.4 | +3.1 | |
| Independent | Chaz Singh | 126 | 5.4 | +5.4 | |
| TUSC | Ryan Aldred | 52 | 2.2 | −0.8 | |
| Majority | 638 | 27.2 | |||
| Turnout | 2,347 | ||||
| Labour hold | Swing | ||||
References
[edit]- ^ "Council compositions". The Elections Centre. Retrieved 3 May 2016.
- ^ "Plymouth". BBC News Online. 19 April 2008. Retrieved 22 September 2009.
- ^ The City of Plymouth (Electoral Arrangements) Order 1978
- ^ The Devon (District Boundaries) Order 1985
- ^ legislation.gov.uk - The City of Plymouth (Electoral Changes) Order 2002. Retrieved on 4 October 2015.
- ^ "Local elections". BBC News Online. Retrieved 22 September 2009.
- ^ "Council and democracy". Plymouth City Council. Retrieved 22 September 2009.
- ^ "Labour lose their majority hold over Plymouth City Council". The Herald. 8 May 2015. Archived from the original on 30 September 2015. Retrieved 2 December 2015.
- ^ "About Plymouth City Council". Plymouth City Council. Retrieved 2 December 2015.
- ^ "Local Authority Byelecion Results - August 1997". Retrieved 19 November 2019.
- ^ "Local Authority Byelecion Results - September 1997". Retrieved 19 November 2019.
- ^ "Local Authority Byelecion Results - May 2002". Retrieved 19 November 2019.
- ^ "Local Authority Byelecion Results - May 2002". Retrieved 19 November 2019.
- ^ "Labour regains control of Plymouth city council". guardian.co.uk. London. 23 June 2006. Retrieved 22 September 2009.
- ^ "Ham by-election". Plymouth City Council. Archived from the original on 9 June 2011. Retrieved 22 September 2009.
- ^ "Local Authority Byelecion Results - June 2013". Retrieved 19 November 2019.
- ^ "Past election results". Plymouth City Council. Retrieved 19 November 2019.
- ^ "Labour hold Stoke ward seat in Plymouth by-election". Plymouth Herald. 27 July 2018.
- ^ "Local Authority Byelecion Results - July 2018". Retrieved 19 November 2019.
- ^ "Local Elections Archive Project — Moor View Ward". www.andrewteale.me.uk. Retrieved 5 December 2023.
- ^ "Local Elections Archive Project — Plympton Chaddlewood Ward". www.andrewteale.me.uk. Retrieved 5 December 2023.
- ^ "Local Elections Archive Project — Efford and Lipson Ward". www.andrewteale.me.uk. Retrieved 5 December 2023.
- ^ "Local Elections Archive Project — Plymstock Dunstone Ward". www.andrewteale.me.uk. Retrieved 5 December 2023.
- ^ "Local Elections Archive Project — St Peter and the Waterfront Ward". www.andrewteale.me.uk. Retrieved 5 December 2023.


 French
 Deutsch