Fișier:Snells law wavefronts.gif

Snells_law_wavefronts.gif(225 × 227 pixeli, mărime fișier: 65 KB, tip MIME: image/gif, în buclă, 10 imagini, 0,1 s)

Acest fișier se află la Wikimedia Commons. Consultați pagina sa descriptivă acolo.

Titel

Descriere fișier

 
Această GIF grafică digitală a fost creată cu MATLAB.
Descriere
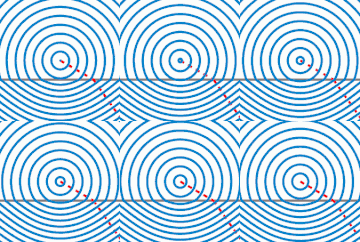
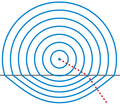
English: Illustration of wavefronts in the context of Snell's law.
Dată (UTC)
Sursă Own work, created with MATLAB. (Source code below.)
Autor Oleg Alexandrov
Permisiune
(Reutilizarea acestui fișier)
Public domain Eu, deținătorul drepturilor de autor ale acestei opere, o eliberez domeniului public. Aceasta se aplică în întreaga lume.
În anumite țări există posibilitatea ca acest lucru să nu fie legal posibil; în acest caz:
permit oricui să utilizeze această operă în orice scop, fără nicio condiție, atâta timp cât asemenea condiții nu sunt cerute de lege.
Alte versiuni
O versiune vectorială a acestei imagini (SVG) este disponibilă.
Aceasta ar trebui folosită în locul vechii imagini pentru o afișare mai bună la rezoluții mari.

File:Snells law wavefronts.gif → File:Snells law wavefronts.svg

Pentru mai multe informații despre imaginile vectoriale, consultați pagina Commons transition to SVG.
Vedeți, de asemenea, și informațiile despre modul în care software-ul MediaWiki acceptă imagini în format SVG.

În alte limbi
Alemannisch  Bahasa Indonesia  Bahasa Melayu  British English  català  čeština  dansk  Deutsch  eesti  English  español  Esperanto  euskara  français  Frysk  galego  hrvatski  Ido  italiano  lietuvių  magyar  Nederlands  norsk bokmål  norsk nynorsk  occitan  Plattdüütsch  polski  português  português do Brasil  română  Scots  sicilianu  slovenčina  slovenščina  suomi  svenska  Tiếng Việt  Türkçe  vèneto  Ελληνικά  беларуская (тарашкевіца)  български  македонски  нохчийн  русский  српски / srpski  татарча/tatarça  українська  ქართული  հայերեն  বাংলা  தமிழ்  മലയാളം  ไทย  한국어  日本語  简体中文  繁體中文  עברית  العربية  فارسی  +/−
Noua imagine SVG

Source code

% Illustration of Snell's law function main()     % indexes of refraction    n1=1.0;    n2=1.5;     sign = -1;% is the source up or down?    O=[0, -1*sign];    k=500;      % KSmrq's colors    red    = [0.867 0.06 0.14];    blue   = [0, 129, 205]/256;    green  = [0, 200,  70]/256;    yellow = [254, 194,   0]/256;    white = 0.99*[1, 1, 1];    black = [0, 0, 0];    gray = 0.5*white;     color1=red;    color2=blue;    color3=gray;    lw = 3;        plot_line=0;    Theta=linspace(0, 2*pi, k);    V=0*Theta; W=0*Theta;    S0=7;    spacing=0.45;    p=floor(S0/spacing);    S=linspace(0, S0, p+1);    spacing=S(2)-S(1);        num_frames = 10;    for frame_iter=1:num_frames        figure(1); clf; hold on; axis equal; axis off;        % plot the interface between diellectrics       L=1.2*S0;       plot([-L, L], [0, 0], 'color', color3, 'linewidth', lw);                     % plot a ray       plot_line=1;       s=L;       theta=pi/3; wfr(s, theta, n1, n2, O, sign, plot_line, color1, lw);        % plot the wafefronts       plot_line=0;       for i=1:p  	 s=S(i)+spacing*(frame_iter-1)/num_frames;  	 for j=1:k 	    theta=Theta(j); 	    [V(j), W(j)]=wfr(s, theta, n1, n2, O, sign, plot_line, color1, lw); 	 end 	 plot(V, W, 'color', color2, 'linewidth', lw);       end               %  dummy points to enlarge the bounding box       plot(0, S0+2.5*spacing, '*', 'color', white);       plot(0, -(S0+2.5*spacing)/n2, '*', 'color', white);        % to know where to crop later       Lx=3.2; Ly=Lx; shift = 1;       plot([-Lx, Lx, Lx, -Lx -Lx], ...            [-Ly, -Ly, Ly, Ly, -Ly]+shift);        file = sprintf('Frame%d.eps', 1000+frame_iter);       disp(file);       saveas(gcf, file, 'psc2')    end end  % Converted to gif with the UNIX command % convert -density 100 -antialias Frame10* Snell_animation.gif  % then cropped in Gimp  function [a, b]=wfr(s, theta, n1, n2, O, sign, plot_line, color1, lw);     X=O+s*[sin(theta), sign*cos(theta)];    if( sign*X(2) > 0 )     t=-sign*O(2)/cos(theta);     X0=O+t*[sin(theta), sign*cos(theta)];          if (plot_line == 1)        plot([O(1), X0(1)], [O(2), X0(2)], 'color', color1, 'linewidth', lw, 'linestyle', '--');     end      d = norm(O-X0);     r = (s-d)*(n2/n1)^(sign);      theta2=asin(n1*sin(theta)/n2);     XE=X0+r*[sin(theta2), sign*cos(theta2)];   else     XE = X;   end     a = XE(1);   b = XE(2);     if (plot_line==1)     plot([X0(1), XE(1)], [X0(2), XE(2)], 'color', color1, 'linewidth', lw, 'linestyle', '--');   end   end 

Captions

Add a one-line explanation of what this file represents
Wavefronts from a point source of light.In a particuler wavefront u will see that the dist btw source & wavefront above the line is > dist btw source & wavefront below the line beacuse lightspeed is greater in the above and lower in below.

Items portrayed in this file

subiectul reprezentat

Istoricul fișierului

Apăsați pe Data și ora pentru a vedea versiunea trimisă atunci.

Data și oraMiniaturăDimensiuniUtilizatorComentariu
actuală5 iulie 2009 12:59Miniatură pentru versiunea din 5 iulie 2009 12:59225x227 (65 KB)Capmoreduced to 16 colors with no quality loss
2 ianuarie 2008 09:31Miniatură pentru versiunea din 2 ianuarie 2008 09:31225x227 (148 KB)Oleg Alexandrov{{Information |Description=Illustration of wavefronts in the context of Snell's law. |Source=self-made with MATLAB |Date=05:36, 1 January 2008 (UTC) |Author= Oleg Alexandrov |Permission= |oth

Următoarele pagini conțin această imagine:

Utilizarea globală a fișierului

Următoarele alte proiecte wiki folosesc acest fișier:

Vizualizați utilizările globale ale acestui fișier.