
 French
 Deutsch
Dosya:Population curve.svg - Vikipedi

Bu SVG dosyasının PNG önizlemesinin boyutu: 547 × 332 piksel. Diğer çözünürlükler: 320 × 194 piksel | 640 × 388 piksel | 1.024 × 622 piksel | 1.280 × 777 piksel | 2.560 × 1.554 piksel.
Tam çözünürlük (SVG dosyası, sözde 547 × 332 piksel, dosya boyutu: 10 KB)
Bu dosya Wikimedia Commons'ta bulunmaktadır. Dosyanın açıklaması aşağıda gösterilmiştir. Commons, serbest/özgür telifli medya dosyalarının bulundurulduğu depodur. Siz de yardım edebilirsiniz. |
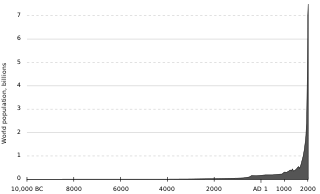
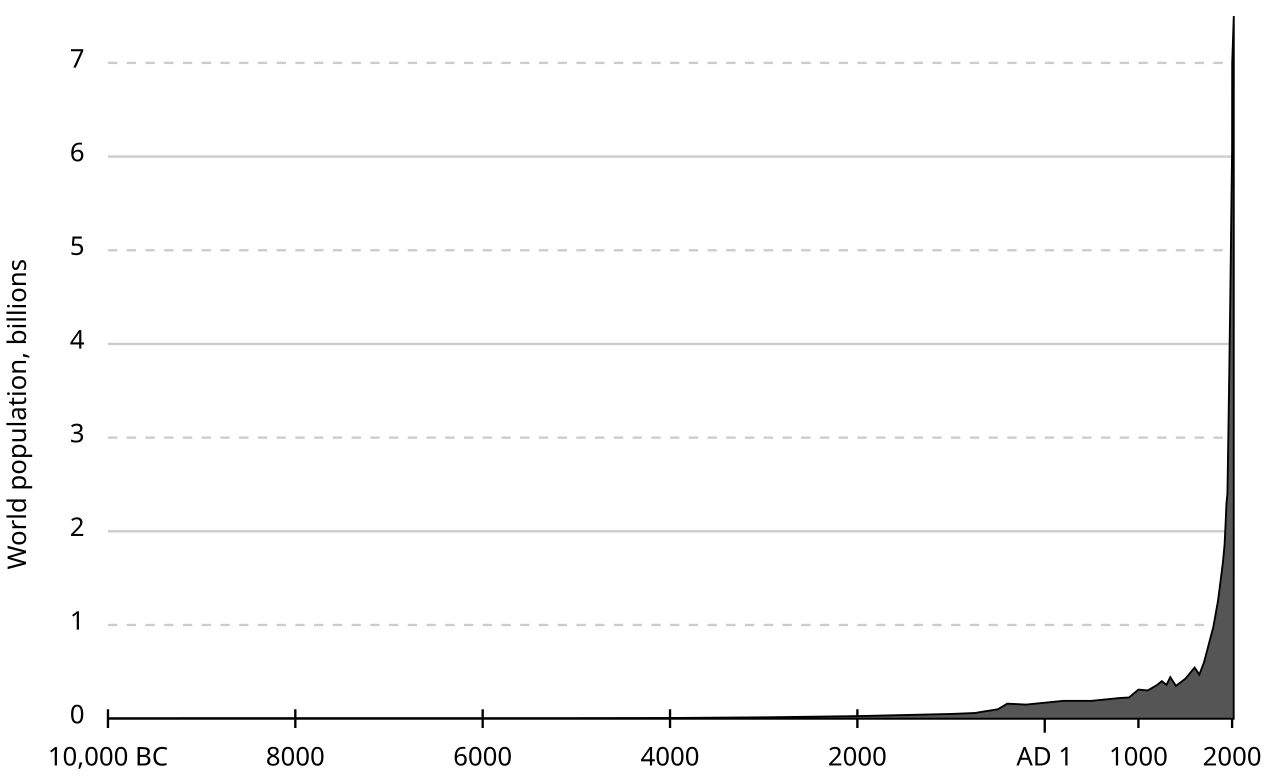
| Açıklama | World human population (est.) 10,000 BCE – 2017 CE. |
| Kaynak | Originally uploaded to en.wikipedia as Population curve.svg. The data is from the "lower" estimates at census.gov (archive.org mirror). |
| Yazar | El T |
| Diğer sürümler | File:Population curve-ar.svg |
| Bu iş yazarı El T at İngilizce Vikipedi tarafından kamu malı olarak yayınlanmıştır. Bu dünya çapında geçerlidir. Bazı ülkelerde bu yasal olarak mümkün olmayabilir; öyleyse: El T, bu işi herhangi bir amaç için, herhangi bir şart olmaksızın, yasalarca gerekli olmadıkça, herkesin kullanmasına izin veriyor. |
Data
year world population (millions) -10000 4 -8000 5 -7000 5 -6000 5 -5000 5 -4000 7 -3000 14 -2000 27 -1000 50 -750 60 -500 100 -400 160 -200 150 1 170 200 190 400 190 500 190 600 200 700 210 800 220 900 226 1000 310 1100 301 1200 360 1250 400 1300 360 1340 443 1400 350 1500 425 1600 545 1650 470 1700 600 1750 790 1800 980 1850 1260 1900 1650 1910 1750 1920 1860 1930 2070 1940 2300 1950 2400 1960 3020 1970 3700 1974 4000 1980 4430 1987 5000 1990 5260 2000 6070 2000.5 6500 * (2000-07-02) 2000.75 6747.5 * (2000-10-02) 2001.2 7000 * (2001-03-15) 2001.3 7000.025 * (2001-04-21) 2017 7500 † * Plotted data points added in 2012-05-24 file revision, with decimal values approximating the dates in parenthesis † Plotted data point added in 2017-08-15 file revision (current)
Note: The above list is only meant to show the data points used to create each version of the "Population curve.svg" image and may contain inaccuracies. Refer to reputable sources for accurate population counts.
Sources
- Biraben, Jean-Noel, 1980, An Essay Concerning Mankind's Evolution, Population, Selected Papers, December, table 2.
- Durand, John D., 1974, "Historical Estimates of World Population: An Evaluation," University of Pennsylvania, Population Center, Analytical and Technical Reports, Number 10, table 2.
- Haub, Carl, 1995, "How Many People Have Ever Lived on Earth?" Population Today, February, p. 5.
- McEvedy, Colin and Richard Jones, 1978, "Atlas of World Population History," Facts on File, New York, pp. 342-351.
- Thomlinson, Ralph, 1975, "Demographic Problems, Controversy Over Population Control," Second Edition, Table 1.
- United Nations (UN), 1973, The Determinants and Consequences ofPopulation Trends, Population Studies, No. 50., p.10.
- United Nations, 1999, The World at Six Billion, Table 1, "World Population From" Year 0 to Stabilization, p. 5, http://www.un.org/esa/population/publications/sixbillion/sixbilpart1.pdf
- U.S. Census Bureau (USCB), 2008, "Total Midyear Population for the World: 1950-2050", Data updated 2008-12-15, https://www.census.gov\/ipc/www/idb/worldpop.html
- U.S. Census Bureau (USCB), 2017-08-15, "International Database (IDB)", https://www.census.gov/programs-surveys/international-programs/about/idb.html
- Note: The USCB updates the International Database annually. Data from 2018 and later is not yet reflected in this chart.
Dosya geçmişi
Dosyanın herhangi bir zamandaki hâli için ilgili tarih/saat kısmına tıklayın.
| Tarih/Saat | Küçük resim | Boyutlar | Kullanıcı | Yorum | |
|---|---|---|---|---|---|
| güncel | 22.24, 15 Ağustos 2017 | | 547 × 332 (10 KB) | Gregor Hagedorn | Updating to 2017/7.5 billion |
| 09.25, 21 Temmuz 2015 |  | 550 × 325 (10 KB) | JorisvS | Reverted to version as of 12:45, 24 May 2012: It breaks the text and numbers in the graph | |
| 18.44, 20 Mayıs 2015 |  | 2.500 × 1.478 (15 KB) | GregKaye | moving to bronze age time scale | |
| 12.45, 24 Mayıs 2012 |  | 550 × 325 (10 KB) | Spesh531 | Adding up to 7 billion, a year is .004 pixels | |
| 10.56, 10 Kasım 2006 |  | 550 × 275 (4 KB) | Dangauthier |
Dosya kullanımı
Bu görüntü dosyasına bağlantısı olan sayfalar:
Küresel dosya kullanımı
Aşağıdaki diğer vikiler bu dosyayı kullanır:
- af.wikipedia.org üzerinde kullanımı
- ar.wikipedia.org üzerinde kullanımı
- ast.wikipedia.org üzerinde kullanımı
- az.wikipedia.org üzerinde kullanımı
- be.wikipedia.org üzerinde kullanımı
- bg.wikipedia.org üzerinde kullanımı
- bn.wikipedia.org üzerinde kullanımı
- ca.wikipedia.org üzerinde kullanımı
- cs.wikipedia.org üzerinde kullanımı
- cs.wikinews.org üzerinde kullanımı
- da.wikipedia.org üzerinde kullanımı
- da.wikibooks.org üzerinde kullanımı
- de.wikipedia.org üzerinde kullanımı
- el.wikipedia.org üzerinde kullanımı
- en.wikipedia.org üzerinde kullanımı
- The Population Bomb
- I = PAT
- Demographic transition
- Paul R. Ehrlich
- Doomsday argument
- Environmental degradation
- Population growth
- Human impact on the environment
- Intraspecific competition
- Albert Allen Bartlett
- Andrey Korotayev
- Wikipedia:Reference desk/Archives/Humanities/2006 September 4
- Wikipedia:Reference desk/Archives/Miscellaneous/2006 October 2
- Estimates of historical world population
- Wikipedia:Graphics Lab/Images to improve/Archive/Mar 2008
- World population
- Talk:World population/Archive 1
- User talk:McSly/Archive 1
- User:Bigmadrich/sandbox
- User:I worship oil
- en.wikibooks.org üzerinde kullanımı
- en.wiktionary.org üzerinde kullanımı
- eo.wikipedia.org üzerinde kullanımı
Bu dosyanın daha fazla küresel kullanımını görüntüle.