1812 United States presidential election in Maryland
| ||||||||||||||||||||||||||
| ||||||||||||||||||||||||||
 County Results
| ||||||||||||||||||||||||||
| ||||||||||||||||||||||||||
| Elections in Maryland |
|---|
 |
| |
The 1812 United States presidential election in Maryland took place on an unknown date in 1812, as part of the 1812 presidential election. Voters chose eleven representatives, or electors to the Electoral College, who voted for President and Vice President.
Early elections were quite different from modern ones. Voters voted for individual electors, who were pledged to vote for certain candidates. Oftentimes, which candidate an elector intended to support was unclear.[1] Prior to the ratification of the 12th amendment, each elector did not distinguish between a vote cast for president and vice president, and simply cast two votes.[2]
Starting with the 1796 United States presidential election and ending with the 1824 United States presidential election, Maryland used an electoral district system to choose its electors, with each district electing a single elector. This method is similar to the way Nebraska and Maine choose their electors in modern elections.
Results
[edit]| Presidential candidate | Party | Home State | Popular Vote | Electoral Vote[3] | |
|---|---|---|---|---|---|
| Count | Percentage | ||||
| James Madison | Democratic- | Virginia | 14,046 | 51.80% | 6 |
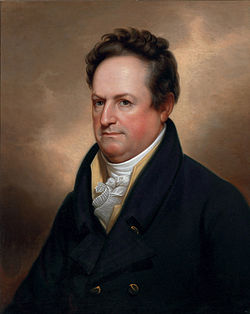
| DeWitt Clinton | Federalist | New York | 13,092 | 48.20% | 5 |
| Total | 27,138 | 100.00% | 11 | ||
Results by electoral district
[edit]| District | James Madison Democratic-Republican | DeWitt Clinton Federalist | Other Federalist | Margin | Total Votes Cast [4] | |||||||
|---|---|---|---|---|---|---|---|---|---|---|---|---|
| # | % | Electors | # | % | Electors | # | % | Electors | # | % | ||
| 1 | 107 | 12.31% | 0 | 757 | 87.11% | 1 | 3 | 0.58% | 0 | -53 | -74.22% | 869 |
| 2 | 959 | 44.29% | 0 | 1,206 | 55.71% | 1 | 0 | 0.00% | 0 | -247 | -11.42% | 2,165 |
| 3 | 6,829 | 64.92% | 2 | 3,689 | 35.08% | 0 | 0 | 0.00% | 0 | 3,140 | 28.03% | 10,518 |
| 4 | 3,925 | 49.24% | 0 | 4,045 | 50.76% | 2 | 0 | 0.00% | 0 | -120 | -1.52% | 7,970 |
| 5 | 1,668 | 69.67% | 1 | 726 | 30.33% | 0 | 0 | 0% | 0 | 942 | 39.34% | 1,780 |
| 6 | 1,840 | 62.18% | 1 | 1,119 | 37.82% | 0 | 0 | 0% | 0 | 721 | 24.36% | 2,959 |
| 7 | 1,238 | 58.64% | 1 | 873 | 41.36% | 0 | 0 | 0.00% | 0 | 365 | 17.28% | 2,111 |
| 8 | 1,484 | 50.49% | 1 | 1,455 | 49.51% | 0 | 0 | 0.00% | 0 | 29 | 0.98% | 2,939 |
| 9 | 189 | 7.77% | 0 | 2,238 | 92.06% | 1 | 4 | 0.002% | 0 | -2053 | -84.29% | 2,431 |
| Total | 14,046 | 51.80% | 6 | 13,092 | 48.20% | 5 | 7 | 0 | 954 | 3.60% | 27,138 | |
Results by county
[edit]| County | James Madison Democratic-Republican | DeWitt Clinton Democratic-Republican | Other Other | Margin | Total Votes Cast [5] | ||||
|---|---|---|---|---|---|---|---|---|---|
| # | % | # | % | # | % | # | % | ||
| Allegany | 436 | 45.85% | 515 | 54.15% | 0 | 0% | -79 | -8.30% | 951 |
| Anne Arundel | 733 | 57.90% | 533 | 42.10% | 0 | 0.00% | 200 | 15.80% | 1,266 |
| Baltimore (City and County) | 4,290 | 73.20% | 1,571 | 26.80% | 0 | 0% | 2,719 | 46.40% | 5,861 |
| Calvert | 339 | 46.57% | 389 | 53.43% | 0 | 0.00% | -50 | -6.86% | 728 |
| Caroline | 502 | 45.18% | 609 | 54.82% | 0 | 0.00% | -107 | -9.64% | 898 |
| Cecil | 768 | 49.58% | 781 | 50.42% | 0 | 0.00% | -13 | -0.84% | 1,549 |
| Charles | 34 | 7.57% | 415 | 92.43% | 0 | 0.00% | -381 | -84.86% | 449 |
| Dorchester | 322 | 29.81% | 758 | 70.19% | 0 | 0.00% | -436 | -40.38% | 1,080 |
| Frederick | 2,216 | 45.08% | 2,590 | 54.92% | 0 | 0.00% | -374 | -9.84% | 4,716 |
| Harford | 1,072 | 76.03% | 338 | 23.97% | 0 | 0.00% | 734 | 52.06% | 1,410 |
| Kent | 467 | 47.46% | 517 | 52.54% | 0 | 0.00% | -50 | -5.08% | 987 |
| Montgomery | 483 | 49.85% | 486 | 50.15% | 0 | 0.00% | -3 | -0.30% | 969 |
| Prince George's | 489 | 44.09% | 620 | 55.91% | 0 | 0.00% | 101 | 8.76% | 1,109 |
| Queen Anne's | 771 | 68.41% | 356 | 31.59% | 0 | 0.00% | 415 | 36.82% | 1,127 |
| St. Mary's | 58 | 18.65% | 253 | 81.35% | 0 | 0.00% | -195 | -62.70% | 321 |
| Somerset | 49 | 6.41% | 716 | 93.59% | 0 | 0.00% | -667 | -87.18% | 765 |
| Talbot | 670 | 48.13% | 722 | 51.87% | 0 | 0.00% | -52 | -3.74% | 482 |
| Washington | 1,364 | 59.20% | 940 | 40.80% | 0 | 0.00% | 424 | 18.40% | 2,304 |
| Worcester | 76 | 8.14% | 858 | 91.86% | 0 | 0.00% | -782 | -83.72% | 934 |
| Total | 14,046 | 51.80% | 13,092 | 48.20% | 0 | 0.00% | 954 | 3.60% | 27,138 |
Counties that flipped from Democratic-Republican to Federalist
[edit]See also
[edit]- United States presidential elections in Maryland
- 1812 United States presidential election
- 1812 United States elections
References
[edit]- ^ While commonly labeled as the Federalist candidate, Clinton technically ran as a Democratic-Republican and was not nominated by the Federalist party itself, the latter simply deciding not to field a candidate. This did not prevent endorsements from state Federalist parties (such as in Pennsylvania), but he received the endorsement from the New York state Democratic-Republicans as well
- ^ "A New Nation Votes". elections.lib.tufts.edu. Retrieved December 22, 2021.
- ^ "Electoral College & Indecisive Elections | US House of Representatives: History, Art & Archives". history.house.gov. Retrieved December 22, 2021.
- ^ Petersen, Svend (1963). A statistical history of the American presidential elections. New York: Ungar.
- ^ "A New Nation Votes". elections.lib.tufts.edu. Retrieved October 31, 2022.
- ^ "County Project (WIP)". Google Docs. Retrieved October 31, 2022.


 French
 Deutsch

