Part of the 1985 Irish local elections
1985 Galway County Council election|
|
|
| |
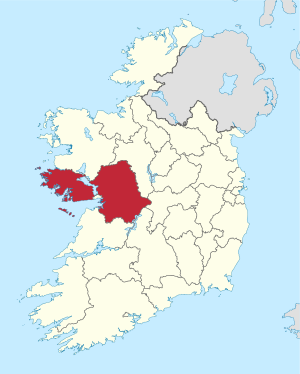 Map showing the area of Galway County Council |
| | Council control after election
Fianna Fail
| |
An election to Galway County Council took place on 20 June 1985 as part of that year's Irish local elections. 30 councillors were elected from five local electoral areas (LEAs) for a five-year term of office on the electoral system of proportional representation by means of the single transferable vote (PR-STV). This term was extended for a further year, to 1991.[1]
Results by local electoral area
[edit] Ballinasloe: 5 seats | Party | Candidate | FPv% | Count |
| 1 | 2 | 3 | 4 | 5 | 6 | 7 | 8 |
| | Fianna Fáil | Michael P. Kitt TD | | 2,368 | | | | | | | |
| | Fianna Fáil | Joe Callanan* | | 1,812 | 2,087 | | | | | | |
| | Fine Gael | Michael Mullins | | 1,634 | 1,667 | 1,689 | 1,809 | 1,836 | 2,159 | | |
| | Independent | Joe Brennan* | | 1,359 | 1,382 | 1,389 | 1,449 | 1,475 | 1,588 | 1,619 | 1,836 |
| | Fianna Fáil | James Joyce* | | 1,181 | 1,227 | 1,292 | 1,304 | 1,516 | 1,577 | 1,587 | 2,044 |
| | Fine Gael | Michael Conneely | | 714 | 730 | 737 | 768 | 864 | 958 | 1,168 | 1,196 |
| | Fianna Fáil | Pat O'Sullivan | | 587 | 636 | 696 | 738 | 870 | 899 | 910 | |
| | Fine Gael | Liam Naughton | | 575 | 581 | 583 | 676 | 682 | | | |
| | Fianna Fáil | Peter Conroy | | 430 | 499 | 586 | 593 | | | | |
| | Fine Gael | Sean Og Hurley | | 395 | 403 | 405 | | | | | |
| Electorate: 15,563 Valid: 11,055 (72.15%) Spoilt: 173 Quota: 1,843 Turnout: 11,228 |
Connemara: 5 seats | Party | Candidate | FPv% | Count |
| 1 | 2 | 3 | 4 | 5 | 6 | 7 | 8 |
| | Fianna Fáil | Nicholas O'Connor* | | 1,842 | | | | | | | |
| | Fine Gael | John Mannion Jnr* | | 1,297 | 1,300 | 1,312 | 1,468 | 1,488 | 1,959 | | |
| | Fianna Fáil | Michael O Moráin* | | 1,042 | 1,201 | 1,205 | 1,270 | 1,334 | 1,350 | 1,367 | 1,567 |
| | Fianna Fáil | Tom Welby Snr* | | 1,005 | 1,016 | 1,026 | 1,030 | 1,034 | 1,158 | 1,216 | 1,534 |
| | Fianna Fáil | Gerald Bartley* | | 967 | 987 | 990 | 992 | 1,002 | 1,014 | 1,033 | 1,208 |
| | Independent | Peadar Ó Tuathail | | 803 | 864 | 900 | 936 | 1,204 | 1,220 | 1,256 | 1,303 |
| | Fianna Fáil | Éamon Ó Cuív | | 799 | 826 | 849 | 855 | 862 | 885 | 915 | |
| | Fine Gael | Paddy Clancy | | 596 | 597 | 609 | 686 | 695 | | | |
| | Fine Gael | Eamonn Moylette | | 373 | 376 | 380 | | | | | |
| | Independent | Noel Mac Donnchadha | | 368 | 385 | 405 | 428 | | | | |
| | Independent | Seosadh Ó Maolaidh | | 114 | 116 | | | | | | |
| | Independent | Christopher Walsh | | 18 | 18 | | | | | | |
| Electorate: 15,670 Valid: 9,224 (59.85%) Spoilt: 154 Quota: 1,538 Turnout: 9,378 |
Galway- 6 seats | Party | Candidate | FPv% | Count |
| 1 | 2 | 3 | 4 | 5 | 6 |
| | Fianna Fáil | Sen. Mark Killilea Jnr* | | 1,917 | | | | | |
| | Fianna Fáil | Bobby Molloy TD* | | 1,776 | | | | | |
| | Fine Gael | Padraig McCormack* | | 1,027 | 1,404 | | | | |
| | Sinn Féin | Paddy Ruane* | | 1,157 | 1,208 | 1,231 | 1,282 | 1,301 | 1,303 |
| | Fianna Fáil | Paddy McHugh | | 1,153 | 1,419 | | | | |
| | Fine Gael | Jarlath McDonagh | | 966 | 1,002 | 1,016 | 1,053 | 1,392 | 1,392 |
| | Fianna Fáil | John Molloy | | 791 | 905 | 1,197 | 1,238 | 1,301 | 1,317 |
| | Fine Gael | Liam MacCana | | 405 | 413 | 435 | 532 | | |
| | Workers' Party | Colm Ó Donnchadha | | 271 | 275 | 299 | | | |
| Electorate: 17,220 Valid: 9,803 (57.55%) Spoilt: 107 Quota: 1,401 Turnout: 9,910 |
Loughrea: 7 seats | Party | Candidate | FPv% | Count |
| 1 | 2 | 3 | 4 | 5 | 6 | 7 | 8 | 9 | 10 | 11 | 12 |
| | Fianna Fáil | Frank Fahey TD* | | 2,389 | | | | | | | | | | | |
| | Fianna Fáil | Michael (Stroke) Fahy* | | 2,147 | | | | | | | | | | | |
| | Fine Gael | Sen. Ulick Burke | | 2,132 | | | | | | | | | | | |
| | Fianna Fáil | Noel Treacy TD | | 1,635 | 1,708 | 1,727 | 1,729 | 1,736 | 1,750 | 1,785 | 1,829 | 2,033 | | | |
| | Fianna Fáil | Tony Murphy* | | 1,112 | 1,161 | 1,182 | 1,187 | 1,189 | 1,198 | 1,247 | 1,250 | 1,278 | 1,363 | 1,368 | |
| | Fianna Fáil | Eddie Haverty* | | 992 | 1,069 | 1,087 | 1,089 | 1,097 | 1,112 | 1,139 | 1,294 | 1,372 | 1,411 | 1,420 | 1,705 |
| | Fianna Fáil | Matt Loughnane | | 950 | 1,027 | 1,058 | 1,061 | 1,067 | 1,091 | 1,113 | 1,156 | 1,320 | 1,372 | 1,387 | 1,803 |
| | Fine Gael | Martin Lynch* | | 854 | 859 | 863 | 876 | 886 | 896 | 916 | 1,014 | 1,097 | 1,486 | 1,488 | 1,772 |
| | Independent | Norman Morgan | | 771 | 776 | 778 | 786 | 799 | 827 | 865 | 931 | | | | |
| | Fine Gael | Enda O'Rourke | | 760 | 769 | 775 | 831 | 834 | 869 | 874 | 974 | 1,043 | | | |
| | Fine Gael | Joe Lambert | | 759 | 821 | 851 | 857 | 896 | 967 | 1,070 | 1,293 | 1,412 | 1,703 | 1,705 | 1,778 |
| | Fine Gael | Jimmy McClearn | | 747 | 748 | 748 | 751 | 793 | 796 | 801 | | | | | |
| | Sinn Féin | Michael Loughrey | | 380 | 398 | 405 | 409 | 410 | 436 | | | | | | | | |
| | Workers' Party | Stan McEoin | | 246 | 257 | 265 | 285 | 286 | | | | | | | |
| | Labour | Peter O'Driscoll | | 124 | 126 | 127 | | | | | | | | | |
| Electorate: 22,507 Valid: 15,998 (71.81%) Spoilt: 165 Quota: 2,000 Turnout: 16,163 |
Tuam: 7 seats | Party | Candidate | FPv% | Count |
| 1 | 2 | 3 | 4 | 5 | 6 | 7 | 8 | 9 | 10 |
| | Independent | Joe Burke* | | 2,438 | | | | | | | | | |
| | Fianna Fáil | Thomas Hussey | | 1,960 | | | | | | | | | |
| | Fianna Fáil | Patrick Finnegan* | | 1,533 | 1,646 | 1,724 | 1,742 | 1,984 | | | | | |
| | Fine Gael | Michael Ryan* | | 1,350 | 1,406 | 1,414 | 1,523 | 1,546 | 1,549 | 1,868 | | | |
| | Sinn Féin | Frank Glynn* | | 1,145 | 1,292 | 1,308 | 1,349 | 1,479 | 1,503 | 1,575 | 1,587 | 1,666 | 1,915 |
| | Fine Gael | Tiernan Walsh | | 974 | 998 | 1,009 | 1,054 | 1,066 | 1,068 | 1,199 | 1,293 | 1,468 | 1,548 |
| | Fianna Fáil | Peter Raftery | | 954 | 960 | 988 | 991 | 1,039 | 1,094 | 1,123 | 1,125 | 1,321 | 1,325 |
| | Fianna Fáil | Michael Dunne | | 818 | 858 | 884 | 897 | 957 | 1,043 | 1,078 | 1,084 | 1,232 | 1,319 |
| | Independent | Gerard Rushe | | 742 | 757 | 761 | 771 | 782 | 783 | 828 | 833 | | |
| | Independent | Jarlath Keane | | 577 | 730 | 738 | 808 | 822 | 824 | 837 | 838 | 869 | |
| | Fine Gael | Jim Mannion | | 566 | 582 | 589 | 682 | 696 | 697 | | | | |
| | Fianna Fáil | Clare Kilgarriff-Fitzgerald | | 556 | 584 | 610 | 630 | | | | | | |
| | Fine Gael | Niall Joyce | | 364 | 456 | 458 | | | | | | | |
| Electorate: 22,507 Valid: 13,979 (71.3%) Spoilt: 181 Quota: 1,748 Turnout: 14,160 |

 French
 Deutsch