Part of the 1985 Irish local elections
1985 Laois County Council election|
|
|
| |
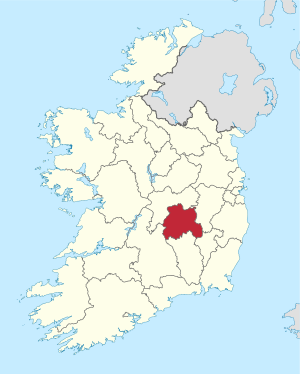
 Map showing the area of Laois County Council |
Council control before election
Fianna Fáil
| Council control after election
Fianna Fáil
| |
An election to Laois County Council took place on 20 June 1985 as part of the 1985 Irish local election. 25 councillors were elected from five local electoral areas (LEAs) for a five-year term of office on the electoral system of proportional representation by means of the single transferable vote (PR-STV). This term was extended for a further year, to 1991.[1]
Results by local electoral area
[edit] Borris-in-Ossory: 7 seats | Party | Candidate | FPv% | Count |
| 1 | 2 | 3 | 4 | 5 | 6 | 7 | 8 | 9 | 10 |
| | Fianna Fáil | Liam Hyland TD* | | 1,479 | | | | | | | | | |
| | Independent | Jimmy Kelly* | | 837 | 873 | | | | | | | | |
| | Fine Gael | William Mansfield* | | 712 | 744 | 745 | 800 | 845 | 850 | 854 | | | |
| | Fine Gael | Sean Jacob* | | 589 | 654 | 655 | 657 | 749 | 751 | 835 | 914 | | |
| | Fine Gael | Jim Phelan* | | 508 | 528 | 529 | 530 | 571 | 572 | 582 | 664 | 785 | 829 |
| | Fianna Fáil | Fintan Phelan | | 390 | 460 | 466 | 493 | 536 | 537 | 569 | 641 | 735 | 737 |
| | Labour | Larry Kavanagh | | 377 | 395 | 402 | 405 | 500 | 501 | 511 | | | |
| | Fianna Fáil | Paddy Phelan* | | 369 | 446 | 447 | 527 | 528 | 531 | 651 | 665 | 723 | 725 |
| | Fianna Fáil | Thomas Fennelly | | 356 | 421 | 423 | 441 | 446 | 447 | 533 | 552 | | |
| | Fine Gael | Brendan Dunne | | 349 | 362 | 368 | 373 | | | | | | |
| | Fianna Fáil | Eddie Kirwan | | 326 | 386 | 387 | 435 | 465 | 470 | 530 | 649 | 821 | 824 |
| | Fianna Fáil | Eamon Rafter* | | 313 | 411 | 412 | 428 | 433 | 433 | | | | |
| | Fianna Fáil | Martin Keane | | 193 | 260 | 262 | | | | | | | |
| | Independent | Brendan Clear | | 31 | 35 | | | | | | | | |
| Electorate: 9,808 Valid: 6,829 (70.01%) Spoilt: 38 Quota: 854 Turnout: 6,867 |
Emo- 4 seats | Party | Candidate | FPv% | Count |
| 1 | 2 | 3 | 4 | 5 |
| | Fianna Fáil | Ray Cribbin | | 691 | 700 | 729 | 903 | |
| | Fianna Fáil | Michael Nerney* | | 684 | 716 | 741 | 852 | |
| | Fine Gael | Jim Buggie* | | 553 | 624 | 711 | 718 | 725 |
| | Labour | Ned Kelly* | | 456 | 593 | 626 | 698 | 747 |
| | Fianna Fáil | Don Cunningham | | 377 | 383 | 394 | | |
| | Fine Gael | Mary Lewis | | 369 | 387 | 495 | 513 | 521 |
| | Fine Gael | John O'Reilly* | | 296 | 298 | | | |
| | Labour | Frank Byrne | | 279 | | | | |
| Electorate: 6,146 Valid: 3,705 (60.93%) Spoilt: 40 Quota: 742 Turnout: 3,745 |
Luggacurren- 4 seats | Party | Candidate | FPv% | Count |
| 1 | 2 | 3 | 4 | 5 | 6 | 7 |
| | Fianna Fáil | Martin Rohan* | | 668 | 674 | 681 | 681 | 712 | 775 | 785 |
| | Fianna Fáil | James Cooney* | | 649 | 679 | 695 | 708 | 927 | | |
| | Fianna Fáil | Mary Wheatley | | 556 | 572 | 593 | 610 | 718 | 760 | 862 |
| | Fianna Fáil | Liam Doran | | 369 | 373 | 386 | 439 | | | |
| | Independent | William Fleming* | | 366 | 408 | 436 | 450 | 455 | 458 | |
| | Independent | John Daly* | | 363 | 403 | 443 | 458 | 489 | 496 | 683 |
| | Fine Gael | Sen. Charles McDonald* | | 338 | 357 | 432 | 649 | 674 | 680 | 755 |
| | Fine Gael | John Gaffney | | 267 | 282 | 347 | | | | |
| | Fine Gael | John Moran | | 240 | 271 | | | | | |
| | Labour | Tony O'Brien | | 211 | | | | | | |
| Electorate: 5,915 Valid: 4,027 (63.13%) Spoilt: 41 Quota: 806 Turnout: 4,068 |


 French
 Deutsch