1988 United States presidential election in Wyoming
| ||||||||||||||||||||||||||
| ||||||||||||||||||||||||||
 County Results Bush 40–50% 50–60% 60–70% 70–80%
| ||||||||||||||||||||||||||
| ||||||||||||||||||||||||||
| Elections in Wyoming |
|---|
 |
The 1988 United States presidential election in Wyoming took place on November 8, 1988. All 50 states and the District of Columbia, were part of the 1988 United States presidential election. State voters chose three electors to the Electoral College, which selected the president and vice president.
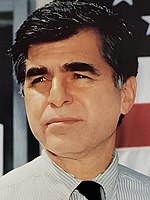
Wyoming was won by incumbent United States Vice President George H. W. Bush of Texas, who was running against Massachusetts Governor Michael Dukakis. Bush ran with Indiana Senator Dan Quayle as vice president, and Dukakis ran with Texas Senator Lloyd Bentsen.
Wyoming weighed in for this election as 14.3 percentage points more Republican than the national average. The presidential election of 1988 was a fairly partisan election for Wyoming, with nearly 98 percent of the electorate voting for either the Democratic or Republican parties, and only four candidates on the ballot.[1]
Bush won the election in Wyoming with a solid 22-point landslide, sweeping all 23 of the state's counties. Dukakis' best county, and Bush's worst, was Sweetwater County, which Bush won by 60 votes, or less than half of 1%. Sweetwater County is one of Wyoming's "Union Pacific counties" that traditionally formed the Democratic Party's base in the state.[2] Bush broke 70% in six counties, of which four were in the state's east and one, Park County, in the Bighorn basin, traditional areas of Republican strength in the state;[3] Sublette County rounded out this group. Overall, however, Bush's 22.52% margin in the state made it 14.80% more Republican than the nation overall. The Mountain West had trended Republican beginning in the 1952 election;[4] after voting for Truman in the nationally close 1948 election, Wyoming had consistently voted to the right of the country in every subsequent election. In 1988, it did so once again, even as some other Mountain states' traditional Republicanism wavered, as in Colorado and Montana. Bush's vote share of 60.53% made Wyoming his third-best state in the region (after Utah and Idaho), and his sixth-best overall (after Utah, New Hampshire, Idaho, South Carolina, and Florida). Along with New Hampshire, Nevada, Delaware, and Maine, it was also one of five states where every county voted for Bush.
Results
[edit]| 1988 United States presidential election in Wyoming | |||||
|---|---|---|---|---|---|
| Party | Candidate | Votes | Percentage | Electoral votes | |
| Republican | George H. W. Bush | 106,867 | 60.53% | 3 | |
| Democratic | Michael Dukakis | 67,113 | 38.01% | 0 | |
| Libertarian | Ron Paul | 2,026 | 1.15% | 0 | |
| New Alliance Party | Lenora Fulani | 545 | 0.31% | 0 | |
| Totals | 176,551 | 100.00% | 3 | ||
Results by county
[edit]| County | George H.W. Bush Republican | Michael Dukakis Democratic | Various candidates Other parties | Margin | Total votes cast | ||||
|---|---|---|---|---|---|---|---|---|---|
| # | % | # | % | # | % | # | % | ||
| Albany | 5,653 | 49.87% | 5,486 | 48.40% | 196 | 1.73% | 167 | 1.47% | 11,335 |
| Big Horn | 3,258 | 68.16% | 1,469 | 30.73% | 53 | 1.11% | 1,789 | 37.43% | 4,780 |
| Campbell | 6,702 | 73.55% | 2,288 | 25.11% | 122 | 1.34% | 4,414 | 48.44% | 9,112 |
| Carbon | 3,336 | 55.70% | 2,555 | 42.66% | 98 | 1.64% | 781 | 13.04% | 5,989 |
| Converse | 2,885 | 68.45% | 1,301 | 30.87% | 29 | 0.69% | 1,584 | 37.58% | 4,215 |
| Crook | 1,939 | 76.34% | 553 | 21.77% | 48 | 1.89% | 1,386 | 54.57% | 2,540 |
| Fremont | 7,681 | 59.59% | 5,020 | 38.95% | 188 | 1.46% | 2,661 | 20.64% | 12,889 |
| Goshen | 3,075 | 61.44% | 1,875 | 37.46% | 55 | 1.10% | 1,200 | 23.98% | 5,005 |
| Hot Springs | 1,490 | 64.11% | 800 | 34.42% | 34 | 1.46% | 690 | 29.69% | 2,324 |
| Johnson | 2,081 | 72.81% | 707 | 24.74% | 70 | 2.45% | 1,374 | 48.07% | 2,858 |
| Laramie | 15,561 | 56.04% | 11,851 | 42.68% | 358 | 1.29% | 3,710 | 13.36% | 27,770 |
| Lincoln | 3,237 | 66.10% | 1,592 | 32.51% | 68 | 1.39% | 1,645 | 33.59% | 4,897 |
| Natrona | 14,005 | 59.63% | 9,148 | 38.95% | 334 | 1.42% | 4,857 | 20.68% | 23,487 |
| Niobrara | 825 | 69.27% | 354 | 29.72% | 12 | 1.01% | 471 | 39.55% | 1,191 |
| Park | 6,884 | 70.95% | 2,646 | 27.27% | 172 | 1.77% | 4,238 | 43.68% | 9,702 |
| Platte | 2,253 | 59.16% | 1,482 | 38.92% | 73 | 1.92% | 771 | 20.24% | 3,808 |
| Sheridan | 5,980 | 55.48% | 4,655 | 43.19% | 143 | 1.33% | 1,325 | 12.29% | 10,778 |
| Sublette | 1,636 | 72.81% | 576 | 25.63% | 35 | 1.56% | 1,060 | 47.18% | 2,247 |
| Sweetwater | 6,780 | 49.47% | 6,720 | 49.03% | 205 | 1.50% | 60 | 0.44% | 13,705 |
| Teton | 3,616 | 61.02% | 2,217 | 37.41% | 93 | 1.57% | 1,399 | 23.61% | 5,926 |
| Uinta | 3,464 | 62.97% | 1,922 | 34.94% | 115 | 2.09% | 1,542 | 28.03% | 5,501 |
| Washakie | 2,538 | 67.36% | 1,197 | 31.77% | 33 | 0.88% | 1,341 | 35.59% | 3,768 |
| Weston | 1,988 | 72.98% | 699 | 25.66% | 37 | 1.36% | 1,289 | 47.32% | 2,724 |
| Totals | 106,867 | 60.53% | 67,113 | 38.01% | 2,571 | 1.46% | 39,754 | 22.52% | 176,551 |
See also
[edit]References
[edit]- ^ "1988 Presidential General Election Results – Wyoming". Dave Leip's Atlas of U.S. Presidential Elections. Retrieved July 21, 2013.
- ^ "Everything About Wyoming - Wyoming Political Myths". www.wyomingalmanac.com. Archived from the original on September 30, 2020. Retrieved December 20, 2020.
- ^ "Everything About Wyoming - Wyoming Political Myths". www.wyomingalmanac.com. Archived from the original on September 30, 2020. Retrieved December 20, 2020.
- ^ Paulson, Arthur C. (2000). Realignment and Party Revival: Understanding American Electoral Politics at the Turn of the Twenty-first Century. Greenwood Publishing Group. ISBN 978-0-275-96865-6.


 French
 Deutsch

