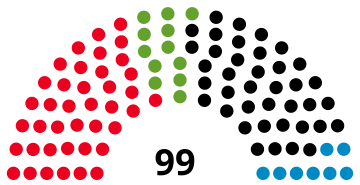
1994 European Parliament election in Germany[1]|
|
|
| Turnout | 60.0% |
|---|
| | First party | Second party | Third party | | | | | | | Party | CDU/CSU | SPD | Greens | | Alliance | EPP | PES | G | | Seats before | 32 | 31 | 8 | | Seats won | 47 | 40 | 12 | | Seat change |  15 15 |  9 9 |  4 4 | | Popular vote | 13,739,447 | 11,389,697 | 3,563,268 | | Percentage | 38.8% | 32,2% | 10.1% | | Swing |  1.1% 1.1% |  5.1% 5.1% |  1.7% 1.7% | |
An election of the delegation from Germany to the European Parliament was held in 1994.
Due to the accession of the former East German states in 1990, these were first EU elections in Germany to have East Germans voting.
 |
|---|
| Party or alliance | Votes | % | Seats | +/– |
|---|
| PES | | Social Democratic Party | 11,389,697 | 32.16 | 40 | +9 |
| EPP | | Christian Democratic Union | 11,346,073 | 32.04 | 39 | +14 |
| G | | Alliance 90/The Greens | 3,563,268 | 10.06 | 12 | +5 |
| EPP | | Christian Social Union | 2,393,374 | 6.76 | 8 | +1 |
| EUL | | Party of Democratic Socialism | 1,670,316 | 4.72 | 0 | New |
| ELDR | | Free Democratic Party | 1,442,857 | 4.07 | 0 | –4 |
| NI | | The Republicans | 1,387,070 | 3.92 | 0 | –6 |
| NI | | League of Free Citizens | 385,676 | 1.09 | 0 | New |
| NI | | The Grays – Gray Panthers | 275,866 | 0.78 | 0 | New |
| NI | | Ecological Democratic Party | 273,776 | 0.77 | 0 | 0 |
| NI | | Car-drivers' and Citizens' Interests Party | 231,265 | 0.65 | 0 | New |
| NI | | Statt Party | 168,738 | 0.48 | 0 | New |
| NI | | Party of the Willing to Work and Socially Vulnerable | 127,104 | 0.36 | 0 | New |
| NI | | Bavaria Party | 110,778 | 0.31 | 0 | 0 |
| NI | | New Forum | 107,615 | 0.30 | 0 | New |
| NI | | Party of Bible-abiding Christians | 93,210 | 0.26 | 0 | New |
| NI | | Natural Law Party | 92,031 | 0.26 | 0 | New |
| NI | | German Social Union | 80,618 | 0.23 | 0 | New |
| NI | | National Democratic Party | 77,227 | 0.22 | 0 | 0 |
| NI | | Christian Centre | 66,766 | 0.19 | 0 | 0 |
| NI | | Christian League | 40,115 | 0.11 | 0 | 0 |
| NI | | Die Unregierbaren – Autonome Liste | 37,672 | 0.11 | 0 | New |
| NI | | Bürgerrechtsbewegung Solidarität | 23,851 | 0.07 | 0 | New |
| NI | | Platform Europe for Workers and Democracy | 12,992 | 0.04 | 0 | 0 |
| NI | | Federation of Socialist Workers | 10,678 | 0.03 | 0 | 0 |
| NI | | Family Party of Germany | 2,781 | 0.01 | 0 | New |
| Total | 35,411,414 | 100.00 | 99 | +18 |
|
| Valid votes | 35,411,414 | 97.56 | |
|---|
| Invalid/blank votes | 884,115 | 2.44 | |
|---|
| Total votes | 36,295,529 | 100.00 | |
|---|
| Registered voters/turnout | 60,473,927 | 60.02 | |
|---|
| Source: Federal Statistics Office |
|
|---|
| 1979 | |
|---|
| 1984 | |
|---|
| 1989 | |
|---|
| 1994 | |
|---|
| 1999 | |
|---|
| 2004 | |
|---|
| 2009 | |
|---|
| 2014 | |
|---|
| 2019 | |
|---|
| 2024 | |
|---|
| 2029 | - Austria
- Belgium
- Bulgaria
- Croatia
- Cyprus
- Czech Republic
- Denmark
- Estonia
- Finland
- France
- Germany
- Greece
- Hungary
- Ireland
- Italy
- Latvia
- Lithuania
- Luxembourg
- Malta
- Netherlands
- Poland
- Portugal
- Romania
- Slovakia
- Slovenia
- Spain
- Sweden
|
|---|
| Off-year | |
|---|


 French
 Deutsch