1924 United States presidential election in New Jersey
| |||||||||||||||||||||||||||||||||
| |||||||||||||||||||||||||||||||||
 County Results
| |||||||||||||||||||||||||||||||||
| |||||||||||||||||||||||||||||||||
| Elections in New Jersey |
|---|
 |
The 1924 United States presidential election in New Jersey took place on November 4, 1924. All contemporary 48 states were part of the 1924 United States presidential election. Voters chose 14 electors to the Electoral College, which selected the president and vice president.
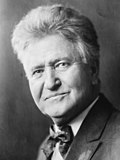
New Jersey was won in a landslide by the Republican nominees, incumbent President Calvin Coolidge of Massachusetts and his running mate Budget Director Charles G. Dawes of Illinois. Coolidge and Dawes defeated the Democratic nominees, Ambassador John W. Davis of West Virginia and his running mate Governor Charles W. Bryan of Nebraska. Also in the running was the Progressive Party nominee, Senator Robert M. La Follette of Wisconsin and his running mate Senator Burton K. Wheeler of Montana.
Coolidge carried New Jersey overwhelmingly with 62.17% of the vote to Davis’ 27.41%, a victory margin of 34.75%.[1] La Follette finished in a relatively strong third, with 10.03%.
New Jersey in this era was a staunchly Republican state, having not given a majority of the vote to a Democratic presidential candidate since 1892. As the Northeastern Republican Calvin Coolidge was winning a second consecutive Republican landslide nationally, amidst the economic boom and social good feelings of the Roaring Twenties under popular Republican leadership, New Jersey easily remained in the Republican column, with Southern Democrat John Davis having little appeal in the state. Coolidge won a commanding majority statewide even with the Republican vote being split by the strong third party candidacy of Robert La Follette, a Republican Senator who had run as the Progressive Party candidate and peeled away the votes of many progressive Republicans. On the county level map, reflecting the decisiveness of his victory, Coolidge won twenty of the state's 21 counties. Coolidge broke 60% of the vote in all but two counties and 70% of the vote in seven.
The Progressive La Follette, a former Republican Senator who ran to the left of both Coolidge and Davis and appealed most strongly to progressive Republicans, performed most strongly in urban parts of North Jersey. La Follette's double-digit support in urban Hudson County allowed Davis to eke out a narrow plurality there with less than 50% of the vote, after the county had given a majority of the vote to Republican Warren G. Harding in 1920. Davis narrowly won Hudson County even as every other county in the state, and the state as a whole, voted overwhelmingly Republican. While La Follette hurt Coolidge's vote share in urban parts of the state, Coolidge did make gains over Harding in some rural parts of the state, in both South Jersey and North Jersey. Whereas Harding had failed to crack 60% of the vote in 4 counties, Coolidge only failed to crack 60% in 2.
Even in the midst of a nationwide Republican landslide, New Jersey's presidential election returns made the state about 10% points more Republican than the nation as a whole, reflecting the state's strong Republican roots in that era, and would ultimately mark the end of that era. Beginning in 1928, the state would begin trending Democratic when the Democratic Party nominated Al Smith, a New York City native and Roman Catholic of Irish, Italian and German immigrant heritage who appealed greatly to urban New Jersey voters, and beginning in 1932, the state would vote Democratic in all four of Democrat Franklin Roosevelt’s elections with the rise of the New Deal Coalition in the state.
Results
[edit]| 1924 United States presidential election in New Jersey | |||||
|---|---|---|---|---|---|
| Party | Candidate | Votes | Percentage | Electoral votes | |
| Republican | Calvin Coolidge (incumbent) | 675,162 | 62.17% | 14 | |
| Democratic | John W. Davis | 297,743 | 27.41% | 0 | |
| Progressive | Robert M. La Follette | 108,901 | 10.03% | 0 | |
| Communist | William Z. Foster | 1,540 | 0.14% | 0 | |
| National Prohibition | Herman P. Faris | 1,337 | 0.12% | 0 | |
| Socialist Labor | Frank T. Johns | 819 | 0.08% | 0 | |
| American | Gilbert Nations | 358 | 0.03% | 0 | |
| Commonwealth Land | William Wallace | 219 | 0.02% | 0 | |
| Totals | 1,086,079 | 100.0% | 14 | ||
Results by county
[edit]| County | John Calvin Coolidge Republican | John William Davis Democratic | Robert Marion La Follette Sr.[2] Progressive | Various candidates Other parties | Margin | Total votes cast[3] | |||||
|---|---|---|---|---|---|---|---|---|---|---|---|
| # | % | # | % | # | % | # | % | # | % | ||
| Atlantic | 27,936 | 73.63% | 6,937 | 18.28% | 2,885 | 7.60% | 181 | 0.48% | 20,999 | 55.35% | 37,939 |
| Bergen | 60,803 | 69.41% | 16,844 | 19.23% | 9,646 | 11.01% | 305 | 0.35% | 43,959 | 50.18% | 87,598 |
| Burlington | 21,617 | 70.23% | 7,794 | 25.32% | 1,288 | 4.18% | 81 | 0.26% | 13,823 | 44.91% | 30,780 |
| Camden | 48,154 | 66.31% | 17,577 | 24.20% | 6,556 | 9.03% | 335 | 0.46% | 30,577 | 42.10% | 72,622 |
| Cape May | 8,139 | 72.37% | 2,611 | 23.22% | 458 | 4.07% | 38 | 0.34% | 5,528 | 49.16% | 11,246 |
| Cumberland | 15,691 | 71.05% | 4,780 | 21.64% | 1,371 | 6.21% | 242 | 1.10% | 10,911 | 49.41% | 22,084 |
| Essex | 123,614 | 66.22% | 41,708 | 22.34% | 20,877 | 11.18% | 474 | 0.25% | 81,906 | 43.88% | 186,673 |
| Gloucester | 15,513 | 72.74% | 4,167 | 19.54% | 1,314 | 6.16% | 334 | 1.57% | 11,346 | 53.20% | 21,328 |
| Hudson | 80,892 | 41.71% | 91,094 | 46.97% | 21,560 | 11.12% | 406 | 0.21% | -10,202 | -5.26% | 193,952 |
| Hunterdon | 8,940 | 60.62% | 5,103 | 34.60% | 647 | 4.39% | 57 | 0.39% | 3,837 | 26.02% | 14,747 |
| Mercer | 30,689 | 59.53% | 14,639 | 28.40% | 6,067 | 11.77% | 156 | 0.30% | 16,050 | 31.13% | 51,551 |
| Middlesex | 34,556 | 62.28% | 16,373 | 29.51% | 4,371 | 7.88% | 182 | 0.33% | 18,183 | 32.77% | 55,482 |
| Monmouth | 34,451 | 65.64% | 14,931 | 28.45% | 2,902 | 5.53% | 198 | 0.38% | 19,520 | 37.19% | 52,482 |
| Morris | 24,812 | 69.59% | 8,042 | 22.56% | 2,685 | 7.53% | 116 | 0.33% | 16,770 | 47.03% | 35,655 |
| Ocean | 8,677 | 70.99% | 2,594 | 21.22% | 918 | 7.51% | 33 | 0.27% | 6,083 | 49.77% | 12,222 |
| Passaic | 43,384 | 62.33% | 11,644 | 16.73% | 14,082 | 20.23% | 489 | 0.70% | 29,302[a] | 42.10% | 69,599 |
| Salem | 8,027 | 68.86% | 3,206 | 27.50% | 357 | 3.06% | 67 | 0.57% | 4,821 | 41.36% | 11,657 |
| Somerset | 12,986 | 71.12% | 4,143 | 22.69% | 1,069 | 5.85% | 62 | 0.34% | 8,843 | 48.43% | 18,260 |
| Sussex | 6,319 | 61.36% | 3,632 | 35.27% | 302 | 2.93% | 45 | 0.44% | 2,687 | 26.09% | 10,298 |
| Union | 50,356 | 67.99% | 14,738 | 19.90% | 8,576 | 11.58% | 390 | 0.53% | 35,618 | 48.09% | 74,060 |
| Warren | 9,606 | 60.63% | 5,186 | 32.73% | 970 | 6.12% | 82 | 0.52% | 4,420 | 27.90% | 15,844 |
| Totals | 675,162 | 62.17% | 297,743 | 27.41% | 108,901 | 10.03% | 4,273 | 0.39% | 377,419 | 34.75% | 1,086,079 |
See also
[edit]Notes
[edit]- ^ In this county where La Follette ran second ahead of Davis, margin given is Coolidge vote minus La Follette vote and percentage margin Coolidge percentage minus La Follette percentage.
References
[edit]- ^ "1924 Presidential General Election Results - New Jersey". Dave Leip’s Atlas of U.S. Presidential Elections. Retrieved February 5, 2014.
- ^ Géoelections; Popular Vote for Robert LaFollette (.xlsx file for €15)
- ^ Robinson, Edgar Eugene; The Presidential Vote 1896-1932, pp. 271-272 ISBN 9780804716963


 French
 Deutsch


